G Model
CATTOD-8916; No. of Pages8
ARTICLE IN PRESS
Z. Xiao et al. / Catalysis Today xxx (2014) xxx–xxx
5
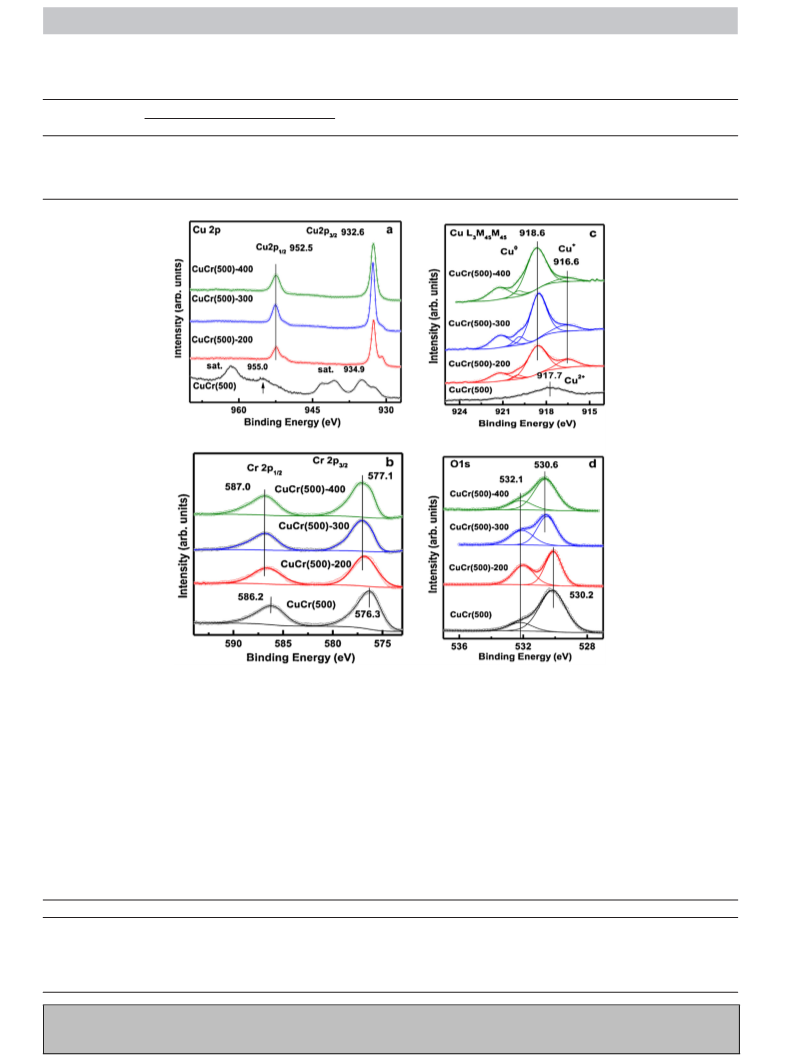
which conventionally are assigned to Cu+ and/or Cu species [13].
Generally, the binding energy for Cu and Cu species is almost the
same, and their difference only manifests itself in the Auger spectra.
The Cu oxidation states can therefore be further identified on
0
the surface oxygen vacancies increased under high reduction tem-
perature, which resulted in an increase of electron concentration
surrounding Cr2O3. In the case of reduction at 200 C, the main spine
remained, and oxygen vacancies were not formed due to the exist-
ence of a large mount of surface OH. Therefore, the central position
of the 530.2 eV peak did not change compared to the unreduced
sample.
0
+
◦
the basis of the Cu L M45M45 Auger spectra, as shown in Fig. 3c.
3
For the unreduced sample, the kinetic energy peak of Cu L M45
M
3
45
2
+
was observed at around 917.7 eV, which can be attributed to Cu
originating from CuCr O [31]. After reduction, however, the Auger
The surface atomic concentration of different samples, calcu-
lated from high-resolution XPS spectra of Cu 2p, Cr 2p, and O 1s
are shown in Table 3. The ratio of the peak intensity of Cu to Cr
in the unreduced samples matched approximately with theoreti-
cally calculated values, which were within experimental errors. It
was noteworthy that the percentage of Cu species on the surface of
reduced samples was higher than in the unreduced one, while there
was no obvious change in the Cr species. These results further indi-
cated that a migration of copper ions from the bulk CuCr2O4 spinel
structure to the surface occurred by reduction in H2 [29,31,36,37].
The oxygen concentration decreased with the increase of reduction
temperature, which might be due to the formation of oxygen vacan-
cies through release of water. The surface atomic concentrations of
different Cu species are shown in Table 3. There was no Cu2+ on the
surface of catalysts after reduction, and the surface concentration of
2
4
L3M45M45 spectra shifted to 916.6, and 918.6 eV corresponding
+
0
to Cu and Cu , respectively [31]. These results indicated that
+
0
Cu was present even under reduction condition, while the Cu
+
amounts increased and Cu amounts decreased with an increase
in the reduction temperature, as shown in Table 3. Significantly,
the migration of Cr onto Cu sites occurred as reported during the
reduction of CuCr O ·CuO [32], which led to the decrease of ICu/ICr
2
4
ratio. Namely, it was found that the fraction of surface Cu
CuCr(500)-400 was lower than that of CuCr(500)-300.
in
total
The high resolution XPS Cr 2p spectra of CuCr(500)-Y catalysts
are shown in Fig. 3b. The Cr 2p spectra consists of two peaks with
BEs of 576.3 and 586.2 eV, which correspond to Cr 2p3/2 and Cr 2p1/2
from CuCr O , respectively [33]. After reduction treatment, the BEs
2
4
of Cr 2p shifted slightly upwards. A process of gradual increase
was observed with an increase of the reduction temperature, in
+
Cu decreased with increasing reduction temperature, while at the
0
which the Cr 2p3/2 and Cr 2p1/2 peaks centered at 576.7 eV and
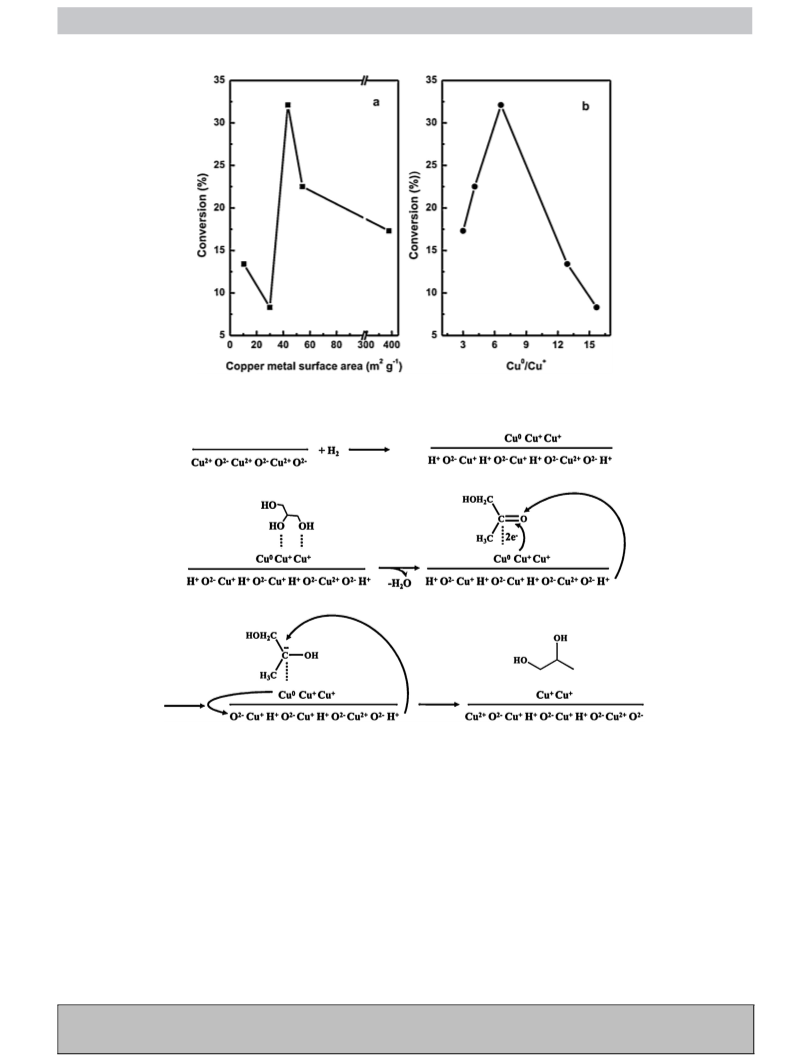
same time the surface concentration of Cu increased. Clearly, the
◦
surface concentration ratio of Cu0 to Cu+ increased as the reduction
5
86.4 eV for the as-reduced samples at 200 C shifted to 577.2 eV
◦
temperature raised.
and 587.0 eV after reduction at 400 C, respectively. These results
might be attributed to the existence of different geometric and
electronic local structures around the metal sites.
Similarly, the surface properties of CuCr(X)-300 catalysts were
examined, the associated surface atomic concentration are shown
2+
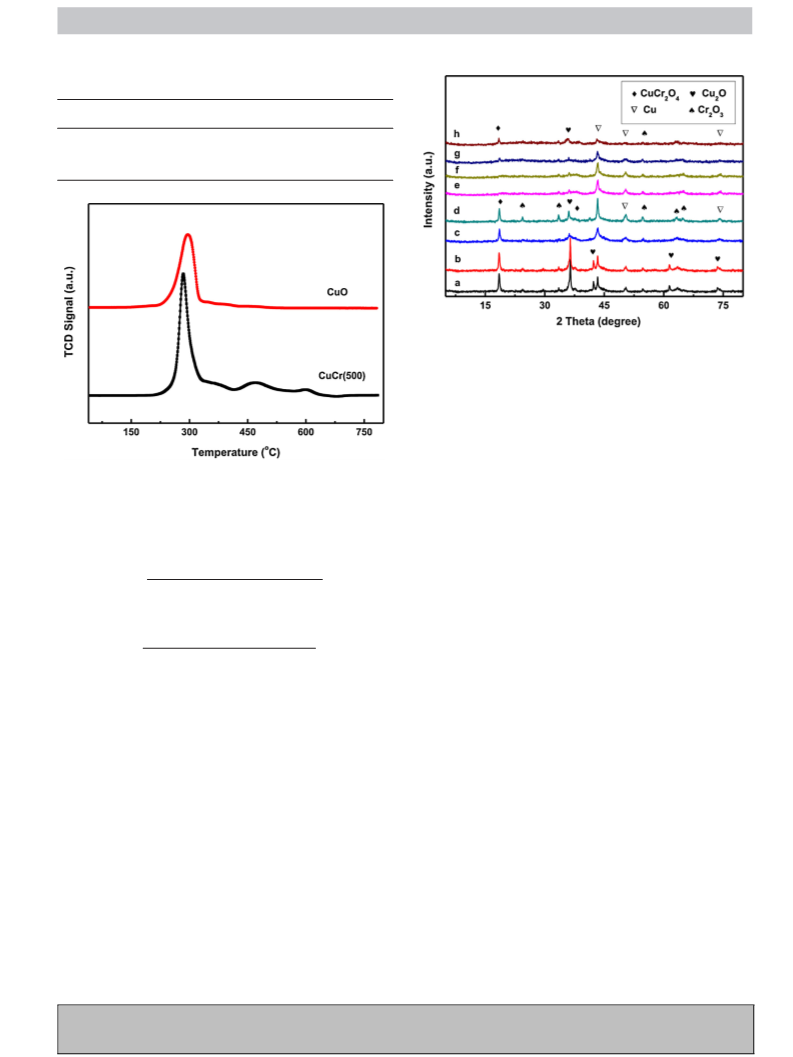
The reduction properties of copper chromite spinel structure
have been reported elsewhere [34]. During the partial reduction
process, hydrogen atoms were incorporated into the crystalline
structure and copper species were partially reduced and changed
their position in the spinel structure. Consequently, the main spinel
structure was transformed to a cubic spinel phase. The symme-
try of peaks suggests that there is only one valence of Cr species.
Interestingly, the observed Cr 2p BE values for reduced samples
are higher than those for pure Cr O reported in the literature
in Table 3, respectively. Results revealed the absence of Cu at
the surface, indicating that the surface Cu was reduced to Cu+
2+
and/or Cu0 species. The Cu L3M45M45 Auger spectra were also
+
0
conducted for determining the concentration of Cu and Cu . An
increase in calcination temperature led to the growth of crys-
tallinity and particle size, which made reduction more difficult at
+
identical temperature. As suggestion, an increase in Cu concentra-
tion and subsequent decrease in Cu0 concentration on the surface
was observed in Table 3. The same as before, the higher ICu/ICr was
obtained, revealing that the Cu0 or Cu+ was epitaxied to the sur-
face in the reduction process leading to an increase of surface Cu
species.
2
3
[
2
35] and approach the values found for Cr(OH)3 (577.5 eV in Ref.
5). Moreover, Khassin has reported vibrational spectra of the
reduced copper chromite that prove the absorption of a consid-
erable amount of hydrogen by the oxide structure and stabilization
of absorbed protons in OH-groups [36]. Plyasova has also reported
that hydrogen is indeed dissolved in the reduced chromite form-
For understanding and predicating the performance of the cat-
alyst, the quantity and strength of acid sites on the catalysts was
determined by NH3-TPD analyses. After adjusting with MS profiles
.
. .
(m/z = 17 and 18), the results of NH -TPD analyses of the Cu-Cr cata-
ing covalent O H bonds with the lattice oxygen [37]. Overall, it
is reasonable to conclude that the hydrogen treatment leads to the
formation of chromium (III) hydroxide, which can be further proved
by the O 1s spectra as discussed below.
3
◦
lysts, which were performed in the temperature range of 40–700 C,
are shown in Fig. 4. Apart from the CuCr(300)-300 catalyst, there
were two desorption peaks in all catalysts after reduction. A low-
◦
To further verify the state of chromium species, the high-
resolution XPS O 1s spectra of CuCr(500)-Y catalysts are shown in
Fig. 3d. The O 1s spectra consists of two peaks with BEs of 532.1
temperature desorption peak (121 C) corresponding to weak acid
sites was observed and did not shift. As the calcination temperature
increased, the high-temperature desorption peak corresponding
◦
to strong acid sites shifted to higher temperature (from 390 to
and 530.2 eV for the unreduced and reduced sample at 200 C,
◦
◦
432 ◦C). However, the relative intensity of desorption peak for
and 532.1, and 530.6 eV for samples reduced at 300 C and 400 C,
respectively. The 532.1 eV peak can be assigned to OH groups
CuCr(600)-300 catalyst decreased comparing to CuCr(500)-300
catalyst, illustrating that the acid sites decreased. For compari-
son, only a low-temperature desorption peak was identified for the
CuCr(500) oxide (CuCr2O4), which suggested that the strong acid
◦
originating from Cr(OH)3 [38]. After reduction at 200 C the cen-
tral position of the 532.1 eV peak remained, whereas its intensity
increased largely compared to the unreduced sample. This result
further suggests that the hydrogen was indeed dissolved in the
site was produced under reduction condition. The strong acid site
reduced chromite forming a covalent O. . .H bond with the lattice
might be related to Cu+ site, since it may function as Lewis acid sites
oxygen [37]. With increasing reduction temperature, the concen-
tration of OH groups decreased due to release in the form of water
and migration of hydrogen into the bulk. In addition, the central
position of the 530.2 eV peak corresponding to O in Cr O upshifted
[39]. However, all catalysts exhibited the low acidity according to
the amount of NH3 desorption. The amount of NH3 desorption for
CuCr(400)-300, CuCr(500)-300, CuCr(600)-300, and CuCr(500) was
0.011, 0.015, 0.012, and 0.031 mmol/g, respectively.
2
3
slightly under reduction condition. This suggested that Cu cations
Copper metal surface area was determined by N2O adsorp-
formed. The main characteristics of the studied samples are
◦
phase under high reduction temperature (above 300 C). Moreover,
Please cite this article in press as: Z. Xiao, et al., Synergetic effect between Cu0 and Cu+ in the Cu-Cr catalysts for hydrogenolysis of

 Xiao, Zihui