130
M. Yadav et al. / Journal of Molecular Liquids 213 (2016) 122–138
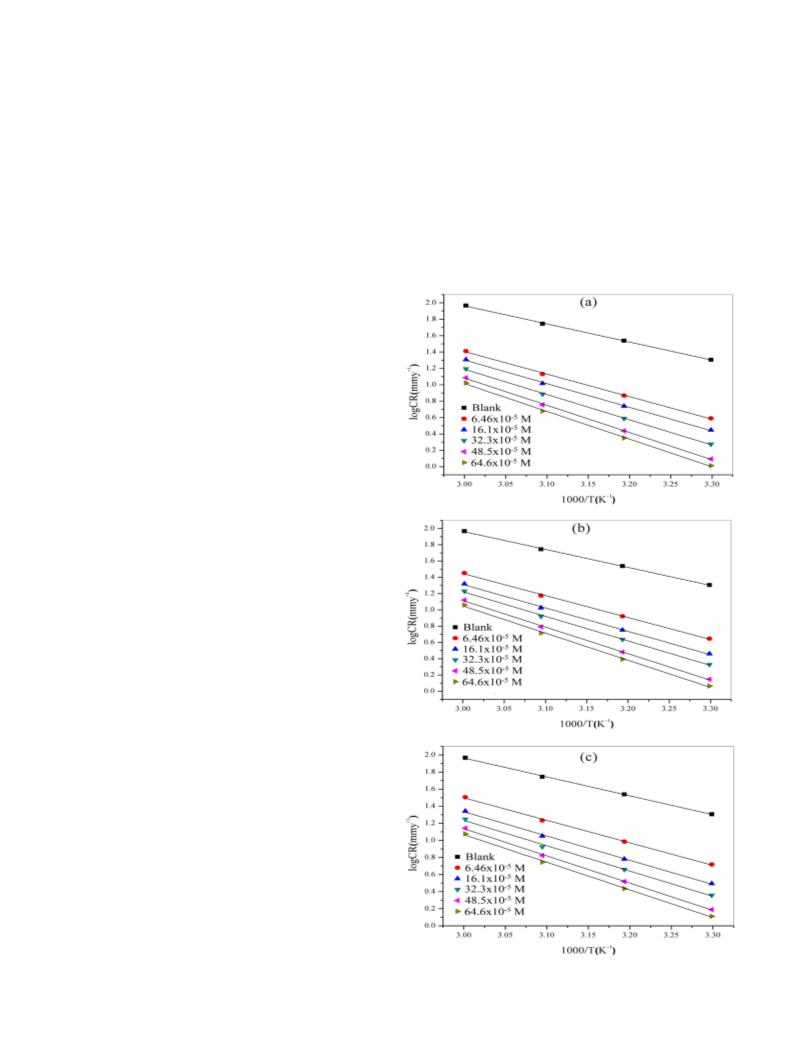
formation of the activated complex in the rate determining step repre-
sents an association rather than a dissociation step, meaning that a de-
crease in disorderliness takes place during the course of the transition
from reactants to activated complex [31].
3
.2. Adsorption isotherm
Basic information on the interaction between the organic inhibitors
and the N80 steel surface are obtained from various adsorption iso-
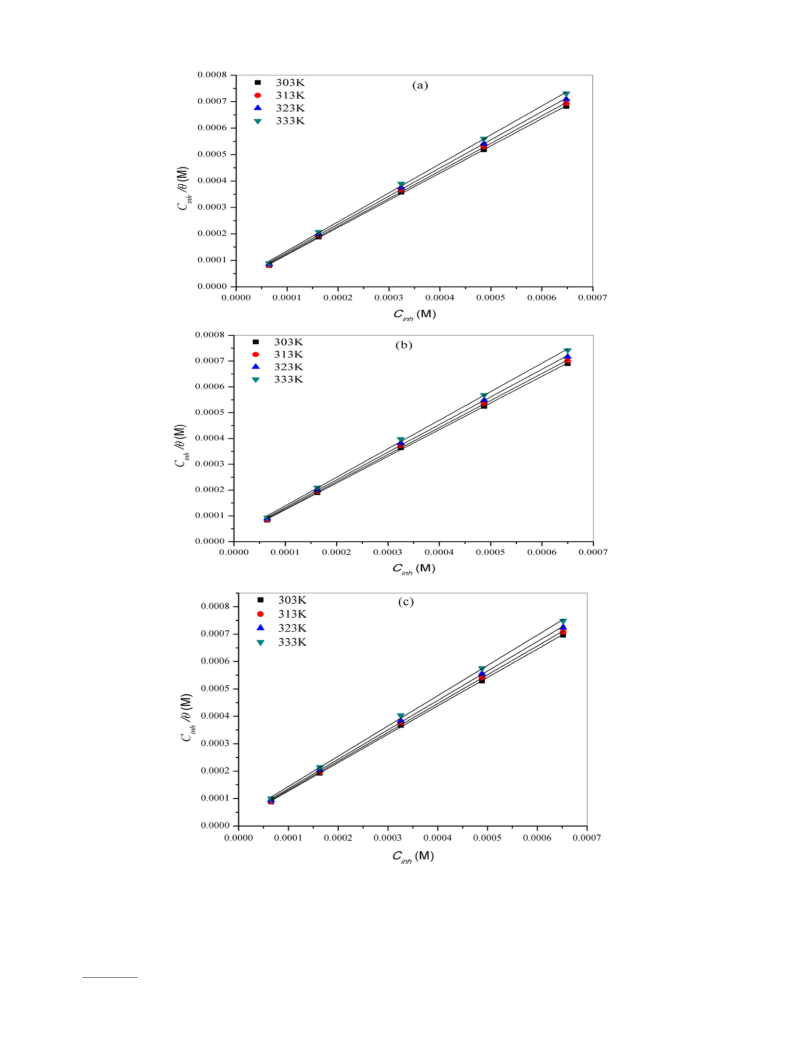
therms. The most commonly used adsorption isotherms are Langmuir,
Temkin, and Frumkin isotherms. The experimental data were fitted
into various adsorption isotherms but Langmuir isotherm gave the
best linear plots. The plots of Cinh/θ vs Cinh at different temperatures
yielded straight lines as shown in Fig. 4. The slope and the correlation
Fig. 7. Equivalent circuit applied for fitting of the impedance spectra.
2
coefficient (R ) values for the Langmuir adsorption plots are listed in
Table 4. The correlation coefficient and slope values in Table 4 are
near to unity, indicating that the adsorption of these inhibitors on N80
steel surface obey Langmuir adsorption isotherm represented by the
equation:
in the absence and presence of the inhibitors but the curves shifted to-
wards lower current density in the presence of inhibitors indicating
that the inhibitor molecules retard the corrosion process without alter-
ing the mechanism of corrosion. The electrochemical parameters such
a
as corrosion potential (Ecorr), anodic Tafel slope (β ), cathodic Tafel
Cinh
θ
1
Kads
slope (β ) and corrosion current density (icorr) were obtained by extrap-
c
¼
þ Cinh
ð9Þ
olating the anodic and cathodic Tafel regions of the curves to the point
of intersection with the Ecorr. The η% was calculated according to Eq. 4
and the results are given in Table 4. The results in Table 4 revealed
that increasing concentration of all the three inhibitors resulted in de-
crease in icorr and increase in η%, which suggests that the inhibitors
adsorbed on N80 steel surface to form protective film thereby reducing
the exposed active sites on the steel surface [35]. The η% values of the in-
hibitors are in the order: PzMBP N MBP N PMBP at 303 K, which is in
agreement with the trend observed from the weight loss experiments.
The presence of inhibitors caused minor change in Ecorr values with
respect to the Ecorr in the absence of inhibitors. This implies that the in-
hibitors act as mixed type inhibitors, retarding the rate of both anodic
and cathodic reactions [36]. If the displacement in Ecorr is more than
± 85 mV relating to corrosion potential of the blank, the inhibitor can
be considered as a cathodic or anodic type [37]. If the change in Ecorr is
less than ± 85 mV, the corrosion inhibitor may be regarded as a mixed
type. The maximum displacement in Ecorr in the present study is
13 mV, which indicates that PzMBP, MBP and PMBP are mixed type
inhibitor.
where, Cinh is the inhibitor concentration, Kads is the equilibrium con-
stant for adsorption–desorption process. From the intercepts of Fig. 4,
the values of Kads were calculated. Large values of Kads obtained for all
the three studied inhibitors imply more efficient adsorption and hence
better corrosion inhibition efficiency. Using the values of Kads, the values
°
of ΔG ads were evaluated by using the equation:
0
ΔG ¼ −RT lnð55:5Kads
Þ
ð10Þ
ads
where R is the gas constant and T is the absolute temperature (K). The
−
1
value of 55.5 is the concentration of water in solution in mol L . The
calculated values of Kads and ΔG°ads are listed in Table 3. In general, the
°
−1
values of ΔGads up to −20 kJ mol are associated with the electrostatic
interaction between charged inhibitor molecules and charged metal
surface (physisorption) and those which are more negative than
−
1
−
40 kJ mol involve charge sharing or charge transfer from the inhib-
itor molecules to the metal surface [32] (chemisorption). The calculated
ΔG°ads values for PzMBP, MBP and PMBP were found in the
range of −37.54 to −40.27, −37.34 to −40.09 and −36.69 to
−
1
−
39.38 kJ mol respectively at different temperatures (303–333 K).
These values are between the threshold values for physical and chemi-
cal adsorption mechanisms indicating that the adsorptions of PzMBP,
MBP and PMBP on N80 steel surface involve competitive physisorption
and chemisorption mechanisms. Quraishi and Shukla [33] studied
Table 5
EIS parameters for corrosion of N80 steel in 15% HCl solution in the presence or absence of
different concentrations of inhibitors at 303 K.
Rs
Rct
Y0
n
Cdl
η%
Concentration (M) (Ω cm ) (Ω cm ) (μF cm−2)
2
2
(μF cm−2)
4
-substituted anilinomethylpropionate as corrosion inhibitors for mild
steel in hydrochloric acid solution. The Gibbs free energy of adsorption
BLANK
0.64
25
695
0.80 252
–
−
1
for these molecules were reported to be around −38 kJ mol and it
was concluded that the adsorption mechanism of these molecules on
steel involved both chemisorption and physisorption interactions.
Similar conclusion was also reported by Ozcan [34], who studied the in-
hibition effect of cystine on mild steel corrosion in sulfuric acid. Thus,
PzMBP
−5
−5
6
1
.46 × 10
6.1 × 10
M
M
M
M
M
0.75
0.78
0.88
0.74
0.76
119
178
228
308
364
163.0
100.2
65.73
44.37
28.61
0.84
0.87
0.90
0.93
0.96
75.3
78.9
86.0
89.1
91.9
93.1
54.4
41.2
32.1
23.8
−
5
5
5
32.3 × 10
4
8.5 × 10−
−
°
64.6 × 10
the calculated values of ΔG ads (Table 4) for all the three inhibitors sug-
gest that the adsorption of these inhibitors on the surface of N80 steel is
not simple physisorption or chemisorption but rather a combination of
both mechanisms.
MBP
.46 × 10−
5
5
5
5
5
M
M
M
M
M
0.84
0.85
0.80
0.76
0.75
104
156
210
278
318
205.7
131.3
58.31
49.52
36.01
0.83
0.86
0.89
0.92
0.95
89.2
67.8
48.3
34.2
28.3
76.0
83.9
88.1
91.0
92.1
6
1
3
4
−
6.1 × 10
2.3 × 10−
8.5 × 10−
−
3
3
.3. Electrochemical studies
64.6 × 10
PMBP
.3.1. Polarization studies
−5
6.46 × 10
M
M
M
M
M
0.63
0.85
0.72
0.61
0.26
89
147
208
272
300
250.2
151.3
117.6
58.2
0.82 102.8
71.9
82.9
87.9
90.9
91.7
−
5
5
5
5
The potentiodynamic polarization curves for N80 steel in 15% HCl
16.1 × 10
0.85
0.88
0.91
0.94
74.7
50.3
38.2
35.4
32.3 × 10−
solution in the absence and presence of various concentrations of
PzMBP, MBP and PMBP at 303 K are shown in Fig. 5. It is apparent
from Fig. 5 that the nature of the polarization curves remains the same
−
4
6
8.5 × 10
4.6 × 10−
46.8

 Yadav
Yadav