X. Lang et al. / Catalysis Communications 70 (2015) 58–61
59
3
. Results and discussions
X-ray photoelectron spectroscopy (XPS) technique was used for
characterization of PS-Cl-CF SO -SO H, to verify the fact that parent
resin (PS-Cl-SO H) was successfully fluorinated by CF SO H. The corre-
sponding XPS spectra for the various elements are shown in Fig. S1
Supporting Information). Clearly, the fluorinated resin showed a signal
of F1s (b) at 687.8 eV (Insert of Fig. S1), indicating the presence of
CF SO -group. The deconvolutions of C1s spectra for fluorinated and
3
2
3
3
3
3
(
3
2
parent resin are shown in Fig. 1. For the parent resin (a), the high re-
solved XPS spectrum of C1s shows at around 284.7 eV, 285.8 eV (α)
and 290.2 eV (β), associated with C–C, C–S, and C–Cl bond of PS-Cl-
SO
91.2 eV (γ) and 287.2 eV (δ) attributed to the C–F [18] and C–S bond
can also be observed in CF SO -resin, confirming successfully graft of –
SO CF onto the network of parent resin [19]. Compared with the parent
resin, the binding energy associated with the C–Cl bond (β) shifted from
3
H, respectively [16,17]. Except for C–C, the new signals at around
2
3
2
2
3
2
1
90.2 eV to 289.3 eV, and the binding energy of S2p region shifted from
68.2 eV to 169.6 eV (Fig. S2). These are attributed to the presence of
electron withdrawing group of –SO
this showed a successful introduction of CF
SO H [21,22]. In other words, the parent resin can be successfully fluo-
rinated by CF SO H.
Herein, the concentration of CF
the preparation of PS-Cl-CF SO -SO
2
CF
3
in fluorinated resin [20]. Thus,
3
2
SO -groups into PS-Cl-
3
3
3
3
SO
3
H plays an important role in
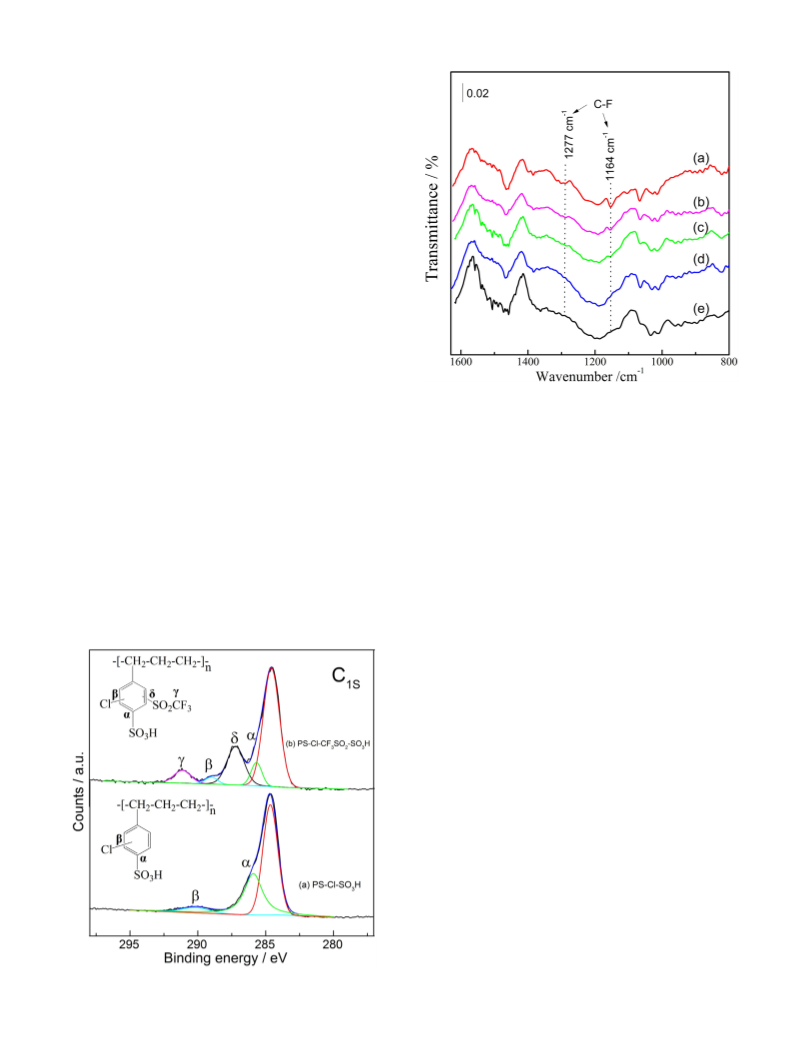
Fig. 2. FT-IR spectra of fluoridated resin modified by different concentrations of CF SO H.
3
3
(a) 5 ml g− , (b) 4 ml g , (c) 3 ml g , (d) 1 ml g , and (e) parent resin.
1
−1
−1
−1
3
2
3
H. Kharitonov et al. [12,23] re-
ported the effect of the concentration of fluorinating agent on parent
resin, and the excessive fluorination may cause the breakage of poly-
mer backbone. But the low concentration of fluorinating agent may
not get the ideal result. Fig. S3 shows the effect of concentration
1006 cm− and 1024 cm−1 are associated with symmetric stretching
vibration of –SO H [24,25]. The chlorinated resins are characterized by
1087 cm band, stretching vibration of C–Cl. Particularly, the asym-
1
3
−
1
of CF
CF SO
capacity of PS-Cl-CF
3
SO
H per gram resin from 2 to 4 ml g , the initial acid exchange
SO -SO H reduced slightly (changing from 2.8
to 2.6 mmol g ). When the concentration of CF SO H was over
the acid exchange capacity drastically dropped, which
3
H on acid exchange capacity. With increasing volume of
−
1
−1
3
3
metric stretching vibration at 1277 cm
and symmetric stretching
are typical bands of CF [26]. Due to the
fact that the processed resin was washed many times, the absorbed
CF SO H on it has been removed thoroughly. As for the same group,
its FT-IR peak intensity is proportional to its amount, thus the higher
−
1
3
2
3
vibration at 1164 cm
2
−
1
3
3
−
1
5
ml g
3
3
−
1
was lower than 1.5 mmol g . Hence, the optimized CF
3
SO
3
H con-
−
1
•
centration in the range of 2 to 4 ml g
PS-Cl-CF SO -SO H resin.
Fig. 2 shows the FT-IR spectra of fluorinated resin treated with dif-
ferent concentrations of CF SO H. As shown in Fig. 2, the bands at
is fit for the preparation of
intensity of C–F bond indicates more CF
shown in Fig. 2, the intensity of two peaks related to the C–F bond
became stronger with the concentration of CF SO H added to the resin
increasing when the concentration of CF SO H was over 4 ml g ,
3 2
SO in phenyl ring of resin. As
3
2
3
3
3
−
1
3
3
3
3
the peaks of the C–F bond can be observed obviously. It is generally
known that the more electrons withdrawing groups resin has, the
higher the acid strength is. Therefore, a relatively high concentration
of CF SO H added to resin can give the resin a better performance in
3 3
acid strength.
As known to all, the fluorination temperature is an important factor
during the preparation of fluorinated resin [27]. Therefore, the effect of
fluorination temperature on resin properties was investigated, shown in
−
1
−1
Fig. 3. The intensity of the C–F bands at 1279 cm and 1163 cm in-
creased with increasing fluorination temperature. In addition, the peak
−
1
assigned to the C–Cl band shifted from 1063 to 1044 cm when fluori-
nation temperature reached 100 °C, which can be explained by the fact
3 2
that the CF SO -group with strong electron-withdrawing results in the
red shift of the C–Cl band.
31
P MAS NMR was performed to figure out the fluorinated influence
on acid strength by using TEPO (triethylphosphine oxide) as probe mol-
ecule. Fig. 4 shows the 3 P MAS NMR spectra of fluorinated and parent
resin. It is suggested that 31P chemical shift of TEPO chemisorbed on
the acid site is related to acid strength [28,29]. As seen from Fig. 4, the
peak at 87 p.p.m of weak acidic sites derived from the TEPO absorbed
1
on –SO
to strong acidic sites. The single peak at 89 p.p.m was observed in the
spectra of CF SO -resin (Fig. 4), and its peak intensity was stronger in
3
H [28], while the characteristic peak at 89 p.p.m was attributed
3
2
comparison to the parent resin. This indicates that PS-Cl-CF
3 2 3
SO -SO H
has more strong acidic sites than the parent resin.
Besides, it is worthwhile to note that the peak due to weak acid sites
almost can't be detected in Fig. 4, indicating that PS-Cl-CF SO -SO
Fig. 1. The C1s spectra of (a) resin and (b) fluorinated resin.
3
2
3
H

 Lang, Xuewei