356
J. Lin et al. / Journal of Catalysis 330 (2015) 354–361
P
P
where Epro and Erea are the total energies of the products and
reactants, respectively. The nudged elastic band (NEB) approach
and frequency analysis were used for identifying transition states
[36]. The theory of atoms in molecules proposed by Bader was
applied to estimate partial charges [37–39].
array spectrophotometer at room temperature. Powder X-ray
diffraction (PXRD) data were collected on a DMAX2500 diffrac-
tometer using Cu Ka radiation. TEM images of the Au nanoparticles
were obtained on a Hitachi 7000 transmission electron microscope
operated at 75 kV. The specimen was made by placing one drop of
a water solution of the Au nanoparticles on a carbon thin-film
coated TEM grid. Fourier transform infrared (FT-IR) was performed
The Au(100) and Au(111) extended surfaces were modeled,
respectively, by (6 ꢃ 6) and (5 ꢃ 5) supercell slabs containing 36
and 50 atoms in two layers. The size of unit cells used for the com-
putations are 12.50 ꢃ 12.50 ꢃ 40.00 Å and 14.60 ꢃ 14.60 ꢃ 40.00 Å
for Au(100) and Au(111) models, respectively. These models are
large enough to accommodate the adsorbed species (e.g., IB) while
avoiding lateral interactions. The top layers of the gold slabs and
the adsorbates were allowed to relax fully during the geometry
optimizations. The gold atoms in the lower layer were kept fixed
at their optimized bulk positions. All calculations were carried
out with the Quantum Espresso package [40].
on a Thermo/ATI/Mattson 60AR instrument (resolution, 1 cmꢁ1
scans, 16; range, 1000–4000 cmꢁ1).
;
2.4. Preparation of ꢀ1 wt.% Au/CeO2
According to previous works, CeO2 can lead to higher catalytic
efficiency in carbonAcarbon coupling reactions (i.e., conversion
and selectivity) of supported gold nanoclusters than other oxide
supports (e.g., TiO2, SiO2, MgO) [15,16,32]. Free (unsupported) gold
colloids are unstable at high temperatures (e.g., 100 °C), as the
water solution turns colorless and formation of black solids at
100 °C is observed at the bottom of the flask for several hours
(the black solids do not dissolve in the fresh water). Therefore,
3. Results and discussion
3.1. Characterization of the Au nanoparticles
CeO2 powder (100 mg) was added to
a 5 mL solution of
as-prepared Au colloids (initial concentration of gold: 0.5 mM in
water, Fig. S2 in the Supporting Information). The mixtures were
stirred for 12 h at room temperature and the supernatant became
colorless. The ꢀ1 wt.% Au/CeO2 catalysts were collected by cen-
trifugation and dried in vacuum. The Au/oxide catalysts were then
heated at 200 °C in air for 2 h.
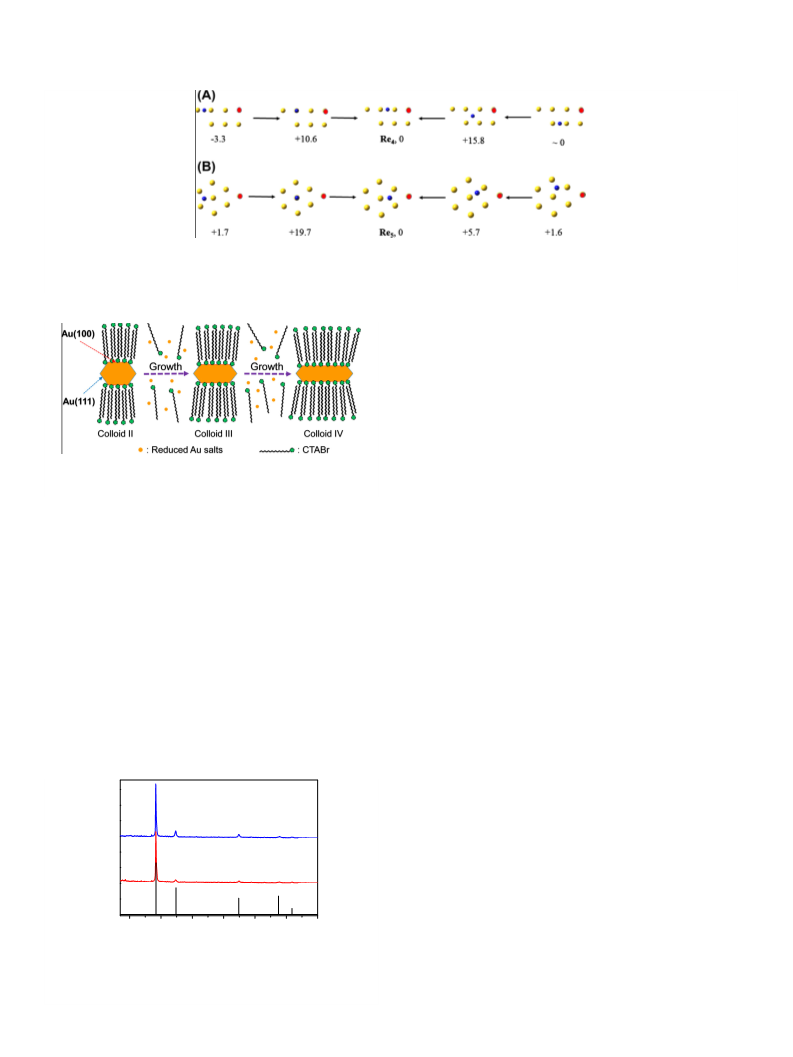
The Au nanorods were synthesized via a two-step method
[30,31]. First, gold seeds were prepared via reduction of HAuCl4
by NaBH4 in the presence of excess CTAB. Next, the gold seeds grew
in the Au(III)/CTAB solution with different amounts of Ag(I) salt.
Finally, the gold nanoparticles Au/CTAB (colloid I) and gold nanor-
ods (colloids II, III, and IV) with different sizes were obtained (see
details in the Experimental section).
2.5. Procedure for the Sonogashira cross-coupling reaction
The as-prepared gold seeds and colloids I–IV are characterized
by UV–vis spectroscopy and TEM, as shown in Fig. 1. In the case
of gold seeds, a shoulder peak can be seen around 520 nm, which
corresponds to the red color2 of the gold seed solution (Fig. 1F, dot-
ted line). As illustrated in Fig. 1A, the TEM image indicates that the
size of the gold seeds is 2–4 nm. The water solution of gold colloid
I also appears in red and the shoulder in the UV–vis spectrum
becomes an obvious absorption peak around 530 nm (Fig. 1F, black
line). The TEM image suggests that the size of the gold colloid I is
20 4 nm (Fig. 1B). The gold seeds and colloid I are shapeless, as evi-
denced by TEM analysis. The gold colloids II, III, and IV turn out to be
violet, deep blue, and pink in water, respectively. As shown in Fig. 1F,
the later gold colloids show two absorption peaks in the UV–vis
spectrum (ꢀ535 and 600 nm for colloid II, ꢀ560 and 670 nm for col-
loid III, and ꢀ530 and 750 nm for colloid IV). According to TEM
In a typical Sonogashira cross-coupling reaction, p-iodoanisole
(CH3OC6H4I, 0.1 mmol), phenylacetylene (0.12 mmol), K2CO3
(0.3 mmol), 1 wt.% Au/oxide (100 mg), and 1 mL DMF were added
to a 5 mL one-necked round-bottom flask. Here we use p-iodoani-
sole and phenylacetylene as reactants only for ease of quantifica-
tion by 1H NMR [15]. The mixture was stirred under N2 at 150 °C
for 24 h as indicated in Table 1. After the catalytic reaction, 5 mL
of water was added to the flask and the products were extracted
twice by 2 mL of ethyl acetate and then characterized by 1H NMR
(300 MHz) after removal of ethyl acetate. Both the conversion of
p-iodoanisole and selectivity for 4,40-dimethoxy-1,10-biphenyl
and 1-methoxy-4-(2-phenylethynyl)benzene were determined by
1H NMR spectroscopic analysis. As shown in Fig. S3 in the
Supporting Information, the NMR analysis identified three compo-
nents in the crude product, residual p-iodoanisole, which shows
signals at d = 3.79 ppm (ACH3), the homo-coupling product 4,40-d
imethoxy-1,10-biphenyl (DMBP) at 3.85 ppm (ACH3), and the
cross-coupling product 1-methoxy-4-(2-phenylethynyl) benzene
(MPEB) at 3.87 ppm (ACH3).
images, lengths of Au colloids are 33 5 (width: 21 3 nm), 42
3
(width: 15 2 nm), and 50 4 nm (width: 13 1 nm) for gold col-
loids II, III, and IV, respectively (Fig. 1C–E). The aspect ratio of length
to width for the gold colloids is ca. 1.6 (colloid II), 2.8 (colloid III), and
3.9 (colloid IV). The optical properties of the Au colloids are consis-
tent with the TEM analysis. Unlike the gold seeds and colloid I, the
gold colloids (II, III, and IV) possess a nanorod-like shape.
2.6. Computational details
3.2. Catalytic performance of the Au colloids in Sonogashira cross-
coupling reactions
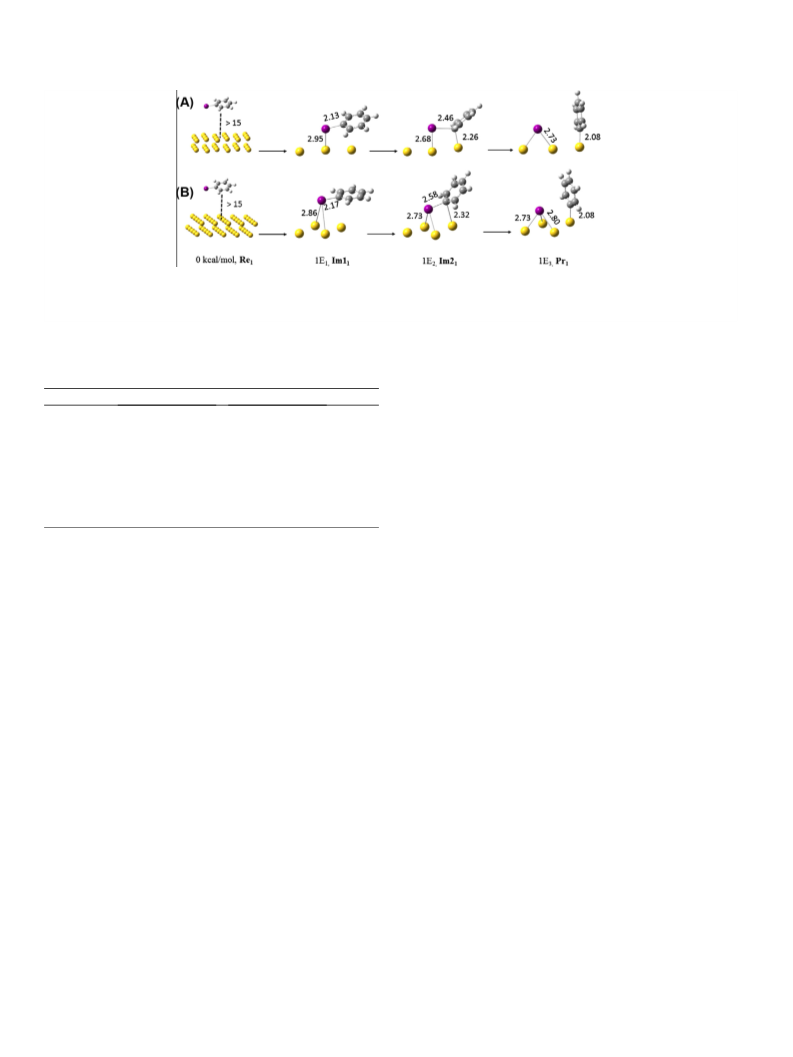
Periodic DFT calculations were performed to investigate mech-
anisms of the Sonogashira cross-coupling reaction between IB and
PA and the competitive Ullmann homo-coupling reaction on two
types of gold surfaces: Au(111) and Au(100). The Projector
Augmented-Wave (PAW) method was used to describe the interac-
tion between the electrons and nuclei [33]. The Perdew–Burke–
Ernzerhof (PBE) form of the generalized gradient approximation
was employed for electron exchange and correlation [34,35]. The
kinetic energy cutoff was chosen to be 450 eV and integration in
The results for the catalytic efficiency of gold seeds and colloids
I–IV in carbonAcarbon coupling reactions are compiled in Table 1.
We first note that Au seed catalyst yields 25% conversion of
p-iodoanisole to 4,40-dimethoxy-1,10-biphenyl (DMBP) and
1-methoxy-4-(2-phenylethynyl) benzene (MPEB) with 37% selec-
tivity for MPEB (Table 1, entry 1). Hereafter, the conversion is
based on consumption of p-iodoanisole, as the phenylacetylene is
excess. Also, the selectivity is calculated with respect to production
the reciprocal space was carried out at the
C k-point of the
Brillouin zone. The reaction energy for a given process is defined as
X
X
2
For interpretation of color in Fig. 1, the reader is referred to the web version of
D
E ¼
Epro
ꢁ
Erea;
this article.

 Lin, Jizhi