1
6
J. Zhang et al. / Materials Research Bulletin 45 (2010) 15–20
2
. Experimental
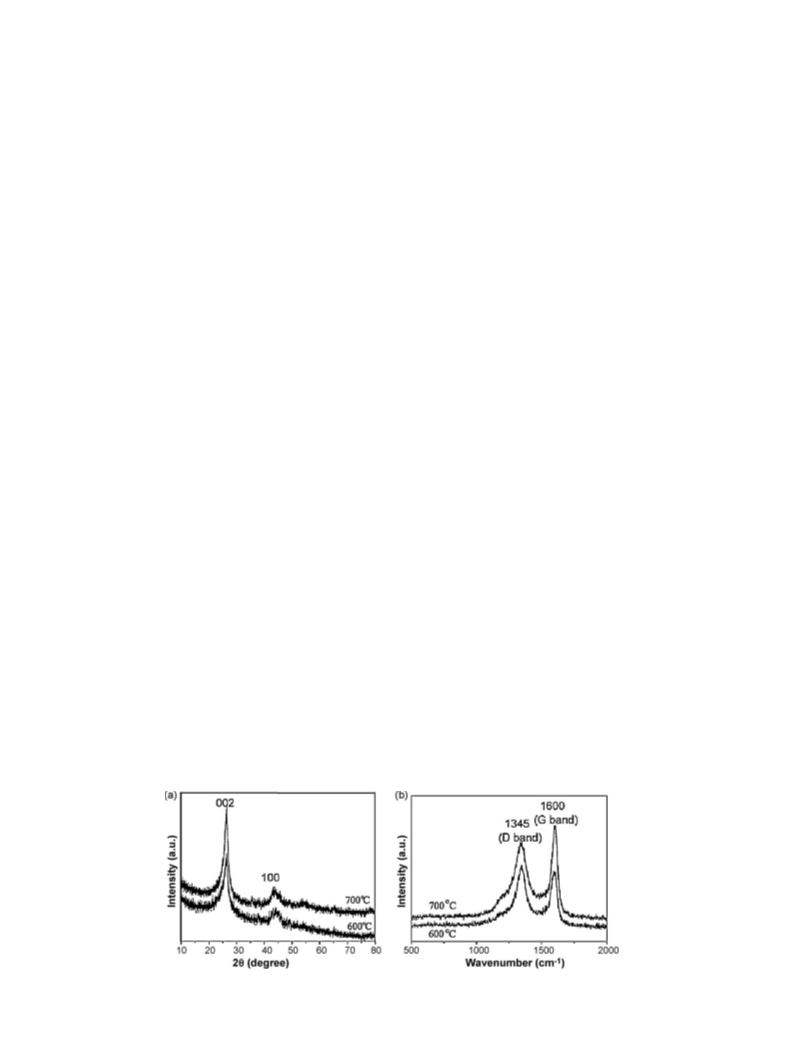
of the product obtained at 600 8C. Fig. 1b gives their corresponding
À1
Raman spectra, showing two similar Raman bands at 1346 cm (D
À1
All chemicals used in this work, such as ferrocene [Fe(C
5
H
5
)
2
]
band) and 1600 cm (G band). More specifically, the two peaks
2
are A. R. regents from the Shanghai Chemical Factory (China). PP
F401) is supplied as pellets by Yangzi Petrochemical Co. (China).
MA-PP is supplied by Chemical Material Co., Ltd. (China), and the
exhibit an E2g mode of graphite related to the vibration of sp -
(
bonded carbon atoms in a 2D hexagonal lattice (such as in a
grapheme layer) and A1g mode of graphite related to the disorder
features due to the finite particle size effect or lattice distortion of
the graphite crystals, respectively [26–28]. Based on the previous
research results [29] and the present Raman spectra, it can be
rationally speculated that the graphitic layers contained in the
product prepared at 700 8C are more regular than that contained in
the product prepared at 600 8C.
grafting yield of maleic anhydride groups is 4 phr and its M
measured by Gel Permeation Chromatograph (GPC) is 30,000.
In a typical experiment, ferrocene (0.50 g), PP (2.00 g, pellets
with diameters of about 4 mm) and MA-PP (0.50 g, pellets with
diameters of about 4 mm) were added into an autoclave reactor of
w
2
0 mL without pre-mixing the components. The reactors were
sealed and maintained at 600 and 700 8C for 12 h, and then allowed
to cool to room temperature naturally. The dark products were
collected and washed with dilute HCl aqueous solution, ethanol,
and distilled water. The final products were dried in a vacuum at
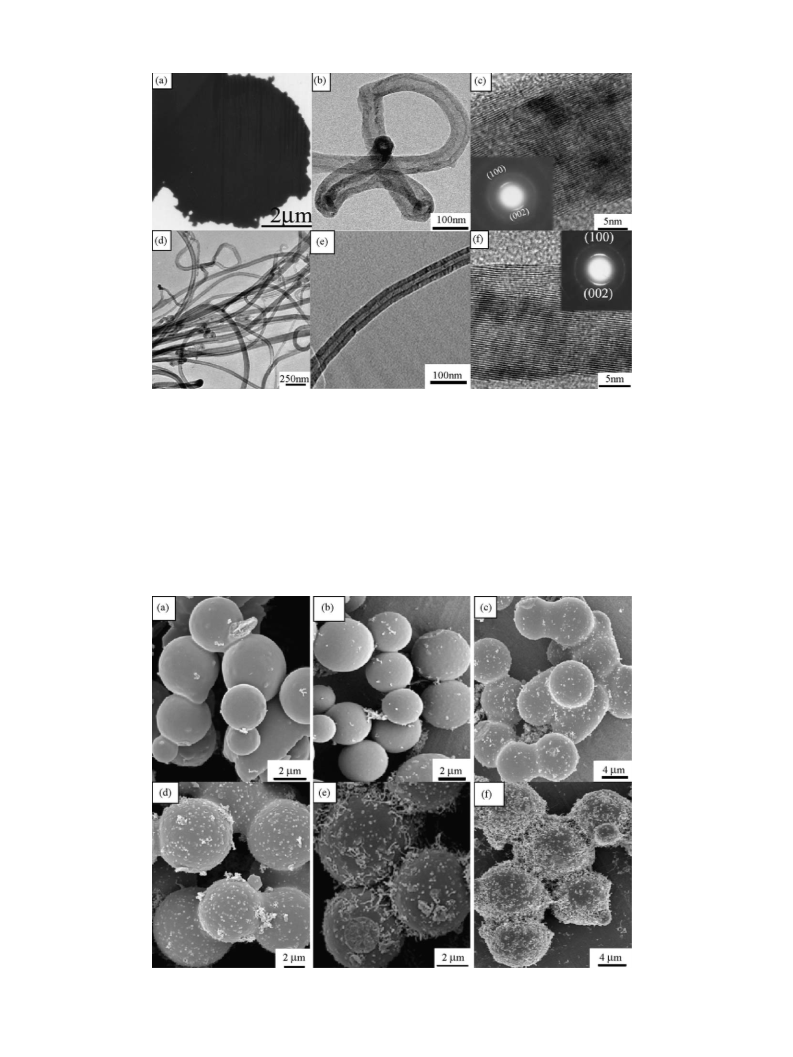
Typical FESEM images in Fig. 2 indicate that large amounts of
MCNTs and CNTs were produced by pyrolysis of PP and MA-PP at
600 and 700 8C. Fig. 2a displays the MCNTs with diameters ranging
from 5.5 to 7.5
mm, and single microsphere with the diameter of
6
0 8C for 6 h.
TiO /CNTs, TiO
6.3 m is shown in Fig. 2b. The magnified FESEM image in Fig. 2c
m
2
2
/MCNTs, CuO/CNTs and CuO/MCNTs catalysts
give more information of the MCNTs’ surface, which reveals that
these microsphere are composed of CNTs with diameters in the
range of 35–55 nm. Fig. 2d, which is the magnified image of region
1 in Fig. 2c, shows that the obtained products include about 4%
carbon nanoparticles according to the FESEM observation. Fig. 2e,
which is the magnified image of region 2 in Fig. 2c, shows that the
surface of MCNTs is rough. However, at the higher temperature of
700 8C, large amounts of CNTs with length of several micrometers
to tens of micrometers are obtained instead of microspheres, as
presented in Fig. 2f and g. Through careful observation of these
images, the carbon nanotubes have smooth and clean surface with
the diameters ranging from 40 to 70 nm.
were prepared by wet impregnation with an aqueous solution of
cupric nitrate and an ethanol solution of analytical tetrabutyl
titanate to give CuO and TiO
2
content of 10%, respectively. After
1
2 h, the obtained solid samples were firstly dried at 100 8C in air
for 12 h and then calcined at 500 8C in air for 3 h. The obtained
samples were used to test their catalytic properties.
The XRD patterns of the products were recorded on a Rigaku
(Japan) D/max-
gA X-ray diffractometer equipped with graphite
˚
monochromatized Cu K
a radiation (l = 1.54178 A). The Raman
spectrums were investigated at ambient temperature on a Spex
403 Raman spectrometer (Ar ion laser, 514.5 nm). The FESEM
1
images of the products were examined by a field-emission scanning
electron microscope (JEOL-6300F). The TEM and HRTEM images and
the SAED patterns were taken on a JEOL 2010 high resolution
transmission electron microscope at an acceleration voltage of
Fig. 3a is the TEM image of a MCNT with the diameter of about
mm prepared at 600 8C. Fig. 3d shows that the inner diameters of
6
the carbon nanotubes prepared at 700 8C are between 7 and 30 nm,
and the outer diameters are between 40 and 70 nm, as well as few
thinner nanotubes were also observed. Fig. 3b and e displays two
individual nanotubes. From the comparison of the two individual
CNTs displayed in Fig. 3b and e, it is found that the wall of the CNT
obtained at 600 8C is rougher than that of the CNT obtained at
700 8C. To further characterize the wall structure of the as-
synthesized CNTs, more detailed studies are executed by HRTEM.
Fig. 3c and f shows HRTEM images for the wall structures of
nanotubes. The interlayer spacings in the walls are about 0.34 nm,
corresponds to the (0 0 2) distance of graphitic carbon lattice. From
the comparison of Fig. 3c and f, it can be observed that the former
has some stacking faults. The SAED patterns (inset in Fig. 3c and f)
are characteristic of CNTs, and the two elongated arcs and circle
correspond to (0 0 2), (1 0 0) planes of graphite carbon, which are
consistent with the XRD and HRTEM results.
2
00 kV. The nitrogen adsorption–desorption isotherms and textural
properties were determined by Beckman Coulter SA3100.
Catalytic experiments were carried out in a continuous flow
fixed-bed quartz reactor (8 mm i.d.) under atmospheric pressure.
0
.3 g catalysts of 40–60 mesh size were loaded, and the catalysts
were pretreated using the mixed gas of 17% O and 83% He for 1 h
at 350 8C. A feed gas mixture of 42% DME, 8% O and 50% He was
2
2
À1 À1
introduced with a space velocity of 3480 mL g
h
. The effluent
was held at 383 K and analyzed on-line by gas chromatographs.
3
. Results and discussion
As shown in Fig. 1a, XRD patterns of the products prepared at
6
00 and 700 8C for 12 h both have two peaks, which can be indexed
as (0 0 2) and (1 0 0) reflections of hexagonal graphite (JCPDS Card
Files, No. 41-1487). Compared with the (0 0 2) peaks, it indicates
the better crystallinity of the product obtained at 700 8C than that
A series of relevant experiments have been carried out through
altering experimental parameters to investigate the effect of
reaction conditions on the formation of MCNTs. It is obvious that
Fig. 1. (a) XRD patterns of the products obtained at 600 8C and 700 8C for 12 h; (b) Raman spectrums of the products obtained at 600 8C and 700 8C for 12 h.

 Zhang, Junhao