E. Guney et al. / Polyhedron 29 (2010) 1437–1442
1441
ligands due to overlapping of decomposition reactions, the total
mass loss (73.2%) at 577 °C agrees well with the calculated total
mass of both ligands (73.6%). On the other hand, the DTA curves
clearly indicate that an exothermic peak at 241 °C corresponds to
the removal of bpeh, while highly exothermic peaks at 510 and
577 °C are characteristic for the decomposition of the sac moiety
[26]. Complex 2 decomposes in two stages. The first stage in the
temperature range 220–456 °C corresponds to the exothermic re-
moval of the bpma ligand with a DTA peak at 288 °C (mass loss:
found 40.4%, calcd. 40.7%). The degradation of the sac ligand takes
place between 460 and 623 °C with a violently exothermic DTA
peak centered at 581 °C (mass loss: found 37.5%, calcd. 37.2%).
The decomposition of both complexes yields metallic silver as a
decomposition product.
4. Conclusions
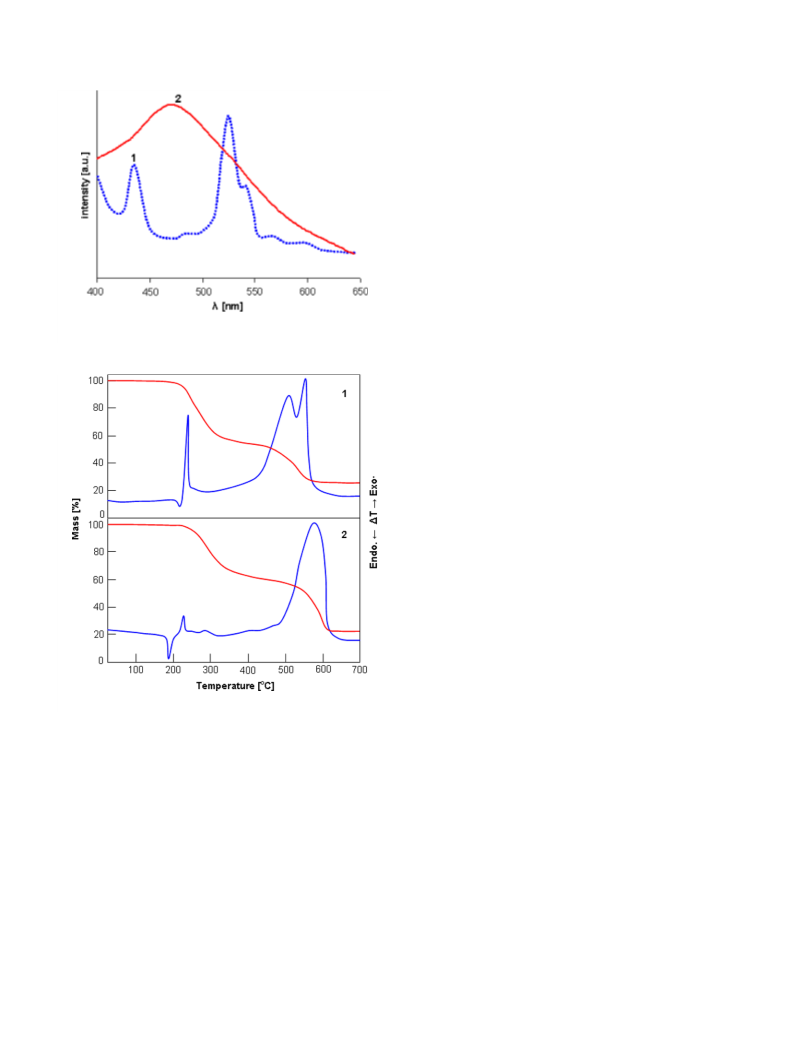
Fig. 3. Emission spectra of complex 1 (upon excitation at 385 nm) and complex 2
(upon excitation at 359 nm) in solid state at room temperature.
In conclusion, the use of two flexible achiral bis(pyridine) li-
gands as sources of conformational chirality leads to the formation
of two chiral complexes [Ag2(sac)2(bpeh)] (1) and [Ag(sac)(bp-
ma)]n (2). Both complexes are characterized spectroscopically
and crystallographically. The chirality of the molecular units is in-
duced by the coordination of the ligands in a twisted chiral confor-
mation. Weak, but significant intermolecular C–HÁ Á ÁO hydrogen
bonds and C–HÁ Á Á
p interactions play very important role in the
construction of three-dimensional supramolecular frameworks.
Both complexes exhibit high thermal stabilities and are fluorescent
at room temperature.
5. Supplementary material
CCDC 752881 and 752882 contain the supplementary crystallo-
graphic data for 1 and 2. These data can be obtained free of charge
Cambridge Crystallographic Data Centre, 12 Union Road, Cam-
bridge CB2 1EZ, UK; fax: (+44) 1223-336-033; or e-mail:
References
[1] E.J. Baran, V.T. Yilmaz, Coord. Chem. Rev. 250 (2006) 1980.
[2] G. Dong, H. Cheng, D. Chun-Ying, Q. Chun-Qi, M. Qing-Jin, New J. Chem. 26
(2002) 796.
[3] G.M. Sheldrick, Acta Crystallogr., A 64 (2008) 112.
[4] R. Karmakar, C.R. Choudhury, S.R. Batten, S. Mitra, J. Mol. Struct. 826 (2007) 75.
[5] C.J. O’Connor, R.J. Romananch, D.M. Robertson, E.E. Eduok, F.R. Fronczek, Inorg.
Chem. 22 (1983) 449.
Fig. 4. DTA and TG curves of 1 and 2.
[6] E.-Q. Gao, Y.-F. Yue, S.-Q. Bai, Z. He, C.-H. Yan, J. Am. Chem. Soc. 126 (2004)
1419.
[7] F. Chen-Jie, D. Chun-Ying, M. Hong, H. Cheng, M. Qing-Jin, L. Yong-Jiang, M. Yu-
Hua, W. Zhe-Ming, Organometallics 20 (2001) 2525.
[8] S. Hamamci, V.T. Yilmaz, W.T.A. Harrison, C. Thone, Solid State Sci. 7 (2005)
423.
[9] S. Hamamci, V.T. Yilmaz, W.T.A. Harrison, Struct. Chem. 16 (2005) 379.
[10] V.T. Yilmaz, S. Hamamci, C. Kazak, Z. Anorg. Allg. Chem. 631 (2005) 1961.
[11] V.T. Yilmaz, S. Hamamci, S. Gumus, O. Buyukgungor, J. Mol. Struct. 794 (2006)
142.
359 nm. The observed red-shift of the emission maximum in 2 is
probably due to a ligand-centered
p–p* process including signifi-
cant charge transfer character induced by the silver(I) ion.
Commonly silver(I) complexes are weakly emissive at low temper-
atures [24,25] and the present results show that complexes 1 and 2
exhibit photoluminescence at ambient temperatures and their
emissions are mainly originated from the co-ligands instead of sac.
[12] V.T. Yilmaz, S. Hamamci, O. Buyukgungor, Z. Naturforsch. 61b (2006) 189.
[13] S. Gumus, S. Hamamci, V.T. Yilmaz, C. Kazak, J. Mol. Struct. 828 (2007) 181.
[14] S. Hamamci, V.T. Yilmaz, S. Gumus, O. Buyukgungor, Z. Naturforsch. 63b
(2008) 139.
[15] S. Hamamci, V.T. Yilmaz, S. Gumus, O. Buyukgungor, Struct. Chem. 19 (2008)
123.
[16] Y.-T. Wang, G.-M. Tang, Y.-Q. Wei, T.-X. Qin, T.-D. Li, J.-B. Ling, X.-F. Long, Inorg.
Chem. Commun. 12 (2009) 1164.
[17] Y.-T. Wang, M.-L. Tong, H.-H. Fan, H.-Z. Wang, X.-M. Chen, J. Chem. Soc., Dalton
Trans. (2005) 424.
3.4. Thermal decomposition
In order to characterize the complexes more fully in terms of
thermal stability, their thermal behaviors were studied by TG
and DTA at the atmosphere of air in the temperature range 25–
900 °C. The TG and DTA curves are illustrated in Fig. 4. Both com-
plexes are stable up to melting points (DTA peaks centered at
220 °C for 1 and 190 °C for 2). After melting, complex 1 displays
two-step decomposition between 195–361 °C and 362–577 °C
with mass losses 43.4% and 29.8%. Although the mass loss in each
stage is not consistent with individual mass of the bpeh and sac
[18] Y.-T. Wang, H.-H. Fan, H.-Z. Wang, X.-M. Chen, Inorg. Chem. 44 (2005) 4148.
[19] Z.D. Bugarcic, G. Liehr, R. van Eldik, J. Chem. Soc., Dalton Trans. (2002) 951.
[20] B. Pitteri, G. Annibale, G. Marangoni, V. Bertolasi, V. Ferretti, Polyhedron 21
(2002) 2283.
[21] K.-Y. Choi, B.-R. Kim, J. Ko, J. Chem. Crystallogr. 37 (2007) 847.

 Guney, Emel