2
E.A. Mikhaleva et al. / Journal of Alloys and Compounds 839 (2020) 155085
coefficient of the volume thermal expansion of the crystal lattice,
ð
ꢀ4
ꢀ1
T
b
¼(1.5e2.0),10
K . In accordance with [24], this can signif-
PCE
AD
LAT
D
SPCE ¼ ꢀ V
m
ðT;
s
Þa
ðT;
sÞds
;
DT
¼ ꢀ C
D
SPCE
;
(1)
icantly effects on BCE. However, the question of the influence of
thermal expansion of the crystal lattice on PCE in ferroelectrics
remained open.
p
where V
m
is the molar volume and
thermal expansion coefficient.
a
¼ lꢀ1ðvl=vTÞs is a linear
Taking in mind the points above, we performed detailed
experimental study of linear thermal expansion near both phase
transition in NH HSO as well as hysteretic phenomena around T2.
4 4
For the first time experimental studies of PCE were carried out
by Joule in the 19th century [9]. He performed the measurements at
room temperature and found that the response of the temperature
of the samples under stress depends on the type of material (wood,
metals. etc.) as well as the magnitude of the tensile/compressive
load and is rather small, mainly due to the small values of the co-
2. Experimental
Rather large single crystals of NH
evaporation at 45 from aqueous solution containing equimolar
quantities of (NH SO and H SO
4 4
HSO were grown by slow
efficient
a of the materials studied.
It is known, however, that thermal expansion can significantly
increase in the region of phase transition of various physical origin.
The reason is that linear/volume strain either is itself an order
parameter (ferroelastic and martensitic transformations) or is
strongly related to the principal order parameter of a different
nature (magnetization, polarization). In both cases, a pronounced
anomalous behavior of the coefficient
of the transition point.
In recent years, much attention has been paid to the study of PCE
in shape memory alloys undergoing the martensitic trans-
formations accompanied by large entropy change [10e13]. Rather
low tensile and compressive stresses created in the samples in the
form of wire or ribbon led to significant values of DTAD and DSCE in
some materials [14,15].
However, in the case of alloys, PCE was measured only in one
direction. On the other hand, as can be seen from Eq. (1), it is
obvious that in anisotropic materials, the magnitude and sign of
4
)
2
4
2
4
.
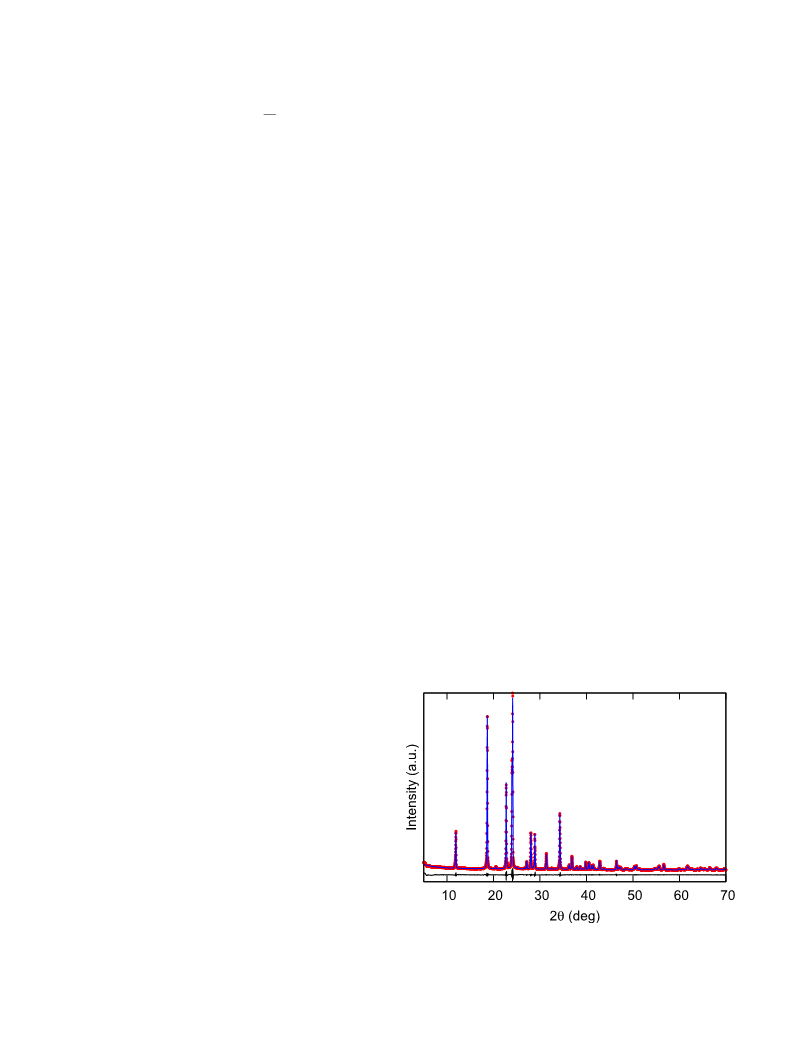
XRD examination of the quality of the sample at room temper-
ature was performed with a Bruker D8 ADVANCE powder diffrac-
tometer (Cu-Ka radiation), TTK 450 Anton Paar heat attachment
and linear VANTEC detector. It revealed, firstly, a monoclinic sym-
metry (sp. gr. P2 =c, Z ¼ 8), consistent with suggested in
1
a is observed in the vicinity
Refs. [23,25,26] and, secondly, the absence of any additional phases.
Fig. 1 shows the results of Rietveld refinement (Rwp¼6.04,
2
R
p
¼ 4.23,
c
¼ 2.06).
A good agreement was found between the unit cell parameters
in the sample under study (a ¼ 14.3954 (7)Å, b ¼ 4.5938 (2)Å,
c ¼ 14.8343 (8)Å, ¼ 120.883 (2) grad) and those determined
earlier in Ref. [25,26].
Further experimental procedure was organized taking in mind
the peculiarities of the phase transitions in NH HSO , Due to a large
b
4
4
volume change in the region of the first order phase transition
Pc4P1, detected when measuring on quasi-ceramic samples pre-
pared using the solution and melt technology [23], we assumed
that single-crystal samples may crack during experiments with
heat treatments around T2.
Therefore, experimental studies were carried out in several
stages. At the first stage, the behavior of linear thermal expansion
was studied on single-crystal specimen in the range from 175 K to
PCE can be different in accordance with the difference in the
a
coefficients along different directions. Recently, we have proved
this assumption studying PCE near ferroelastic phase transitions in
some orthorhombic single crystals [16,17]. It was found that
anisotropy of the crystal lattice allows one to realize conventional
(DTAD > 0, DSCE < 0) and inverse (DTAD < 0, DSCE > 0) PCE in the same
sample using uniaxial stresses applying along different crystallo-
graphic axes. We have also demonstrated that in some case the
values of the uniaxial CE can be comparable with BCE or even
exceed it.
PCE in some ferroelectrics (ceramics, films and single crystals)
was studied experimentally and in the scope of some theoretical
approaches only to a small extent [18e21]. Moreover, in these
materials the effect was also considered only for one direction in
the sample and never the attention was paid to the anisotropy of
PCE.
320 K including the vicinity of the second order phase transition
P2 =c4Pc. The NH HSO sample was cut in the form of rectangular
4
4
1
3
prism with the dimensions of 7.4 ꢁ 8.6 ꢁ 5.9 mm along crystal-
lographic axes a, b, c for the pseudo-orthorhombic cell. Measure-
ments were performed in a vacuum atmosphere (~10 mm Hg)
ꢀ2
Analysis performed recently by U.S. Department of Energy
showed that studies of thermoelastic effects (PCE and BCE) in solids
are the most promising in terms of the development of alternative
cooling technologies [22].
In the present paper, we analyzed the effect of anisotropy of
thermal expansion on the intensive and extensive piezocaloric ef-
4 4
ficiency of ferroelectric NH HSO using method developed by us
earlier [16,17]. Ammonium hydrogen sulphate was chosen as very
convenient model object due to its peculiar and interesting prop-
erties. Firstly, it undergoes the succession of two phase transitions
P2 =c (T ¼271 K)4 Pc (T ¼159 K)4 P1, of the second and first
1
1
2
order, respectively [23]. Secondly, these transformations also differ
greatly from each other by entropy (
D
S ¼1.2 J/mol,K,
D
S2 ¼ 6.7 J/
1
mol,K) and sensitivity to hydrostatic pressure (dT = dp¼þ90± 15 K/
1
GPa and dT =dp ¼ -123±15 K/GPa). Thirdly, strong effect of the
2
4 4
Fig. 1. Rietveld analysis patterns for X-ray powder diffraction of NH HSO at room
hydrostatic pressure on the entropy jump associated with the first
order phase transition at T2 was observed but information on the
temperature hysteresis was absent. Fourthly, far from the phase
temperature. Red dots are experimental data. The blue solid line corresponds to the
calculated intensities. The black line below the profiles stand for the difference be-
tween the observed and calculated intensities. (For interpretation of the references to
colour in this figure legend, the reader is referred to the Web version of this article.)
4 4
transition points, NH HSO is characterized by rather large

 Flerov, Igor N.