DOI: 10.3109/00498254.2012.753490
Metabolite profile analysis of aconitine in rabbit stomach 629
Table 1. The LC gradient program.
intestine, cecum and rectum (Sui et al., 2009). However, there
has been no report about the metabolite profiling of AC in the
stomach. Compared with the intestine, the stomach is usually
believed to have minimal contribution to metabolism and
typically make a much more important contribution to
dissolution and absorption of drugs. Therefore, the biotrans-
formation of drugs in the stomach is usually ignored.
However, the endogenous factors (e.g. pepsin and bacteria)
in the stomach may also have effect on drug metabolism
(Delgado et al., 2011; Gupta et al., 2012). For example, arctiin
has been reported to be transformed into arctigenin in rat
stomach, where the concentration of arctigenin was signifi-
cantly higher than that of arctiin (He et al., 2012). Zhang et al.
(2008) found that polydatin could be transformed into
resveratrol by de-sugaring process in rat stomach. In addition,
baicalin, the main metabolite of baicalein, could be detected
in rat stomach 20 min after oral administration of baicalein
and maintained at a stable concentration for at least 16 h (Liu
et al., 2009). Herein, we focused on the biotransformation of
AC in the stomach, the first site of metabolism in the
alimentary canal.
Time (min)
Flow (mL/min)
A (%)
B (%)
C (%)
0
30
60
120
0.6
0.6
0.6
0.6
35
80
90
0
65
20
10
0
0
0
0
100
Apparatus and operation conditions
The high-performance LC system consisted of a Waters 996
photo-diode array detector and a Waters 2695 HPLC
(Milford, PA) equipped with a Millennium 32 software
program (Milford, PA) for data analysis. Separation of the
components was performed on an Agilent extend C18 column
(4.6 ꢁ 150 mm2, 5 mm; Agilent Technologies Inc, Santa Clara,
CA) with a column temperature of 30 ꢂC. The mobile phase
(Table 1) consisted of mixed organic phase (A), water phase
(B) and pure methanol phase (C). Elution solvent A consisted
of 50% methanol and 50% acetonitrile, and elution solvent B
consisted of 0.2% acetic acid and 2% ammonia, which was
adjusted to the desired pH value (10.50) using ammonia
solution (1%, v/v). The mobile phase flow rate was 0.6 mL/
min. Just before the eluent entered the MS, its flow rate was
reduced to 0.3 mL/min by a split-flow valve.
Owing to the high toxicity, AC should be orally
administered with low dose, which causes low concentrations
of AC and its metabolites in the biological samples.
Therefore, it is necessary to choose a sensitive and specific
analytical method. Liquid chromatography/electrospray ioni-
zation/multiple-stage tandem mass spectrometry (LC/ESI/
MSn) can meet the above-mentioned requirements and has
been widely used in pharmaceutical research, especially in
studies of drug metabolism. Because AC-type alkaloids have
a strong gaseous basicity and proton affinity, they are also
suitable for ESI/MSn analysis.
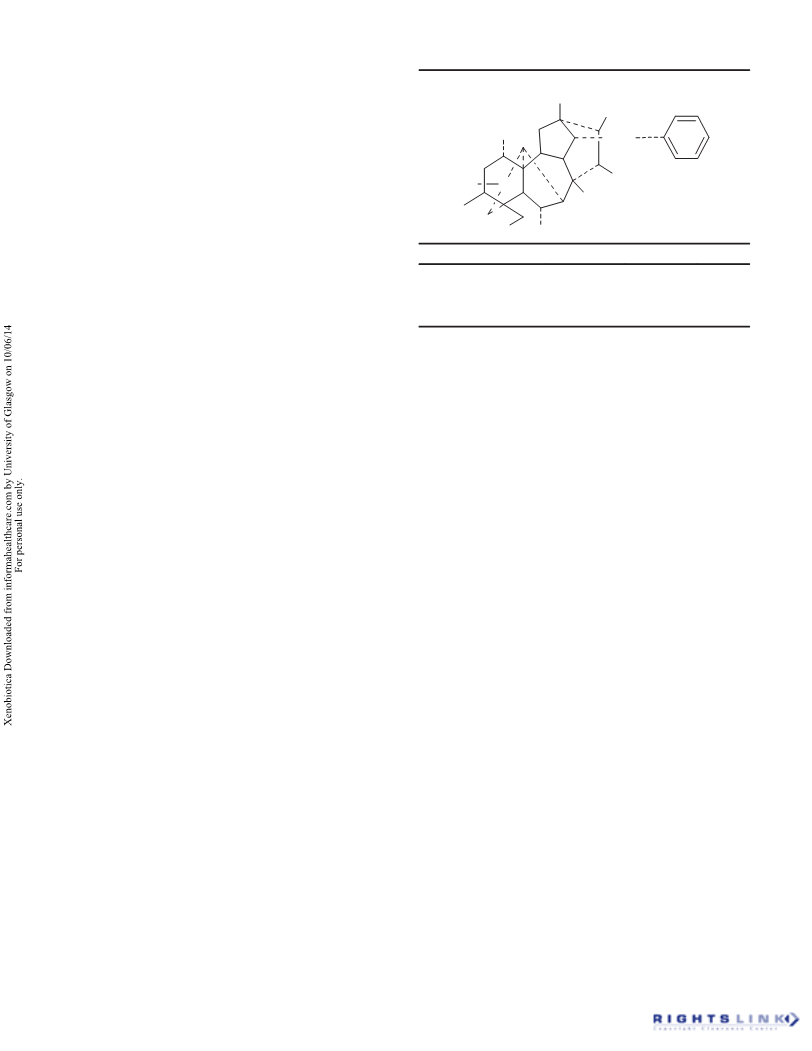
In this study, LC/ESI/MSn in positive ion mode was used
to elucidate and identify the metabolites of AC. To
investigate the metabolism of AC sufficiently, rat and
rabbit were chosen as the model animals. To determine if
the acid environment in stomach will ‘‘metabolize’’ the AC,
comparative data of AC incubated in acidic solution were
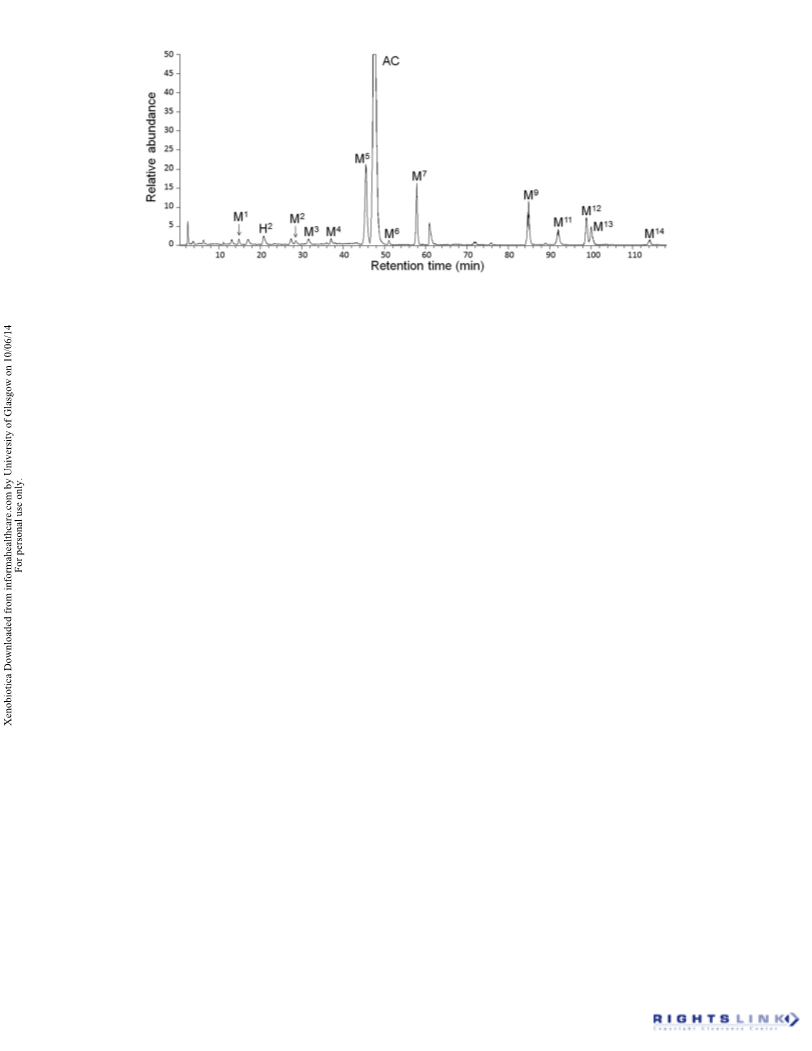
also provided. Totally, 14 metabolites were unambiguously
identified or tentatively deduced by comparing their
protonated molecules, fragmentation pathways and chroma-
tographic behaviors with those of standard compounds and
reports in literature works. The elemental compositions of
some product ions were also analyzed by Fourier transform
ion cyclotron resonance mass spectrometry (FT-ICR-MS).
Finally, a biotransformation pathway of AC in the stomach
was proposed.
MS was performed on a LCQ ion trap mass spectrometer
(Finnigan, San Jose, CA) with an electrospray source. The
spraying voltage was set at 5.00 kV, the tube voltage at 15 V,
the capillary voltage at 17 V and the capillary temperature at
200 ꢂC. The LC fluid was nebulized using high-purity
nitrogen (N2). The sheath gas and auxiliary gas flow rates
were set at 60 and 10 arbitrary units, respectively. The
collision gas used for MSn was helium (He). The collision
energies (%) ranged from 25% to 40%, and the isolation width
was 1.5 mass units. Data were collected and analyzed by
Xcalibur software (version 1.0; Thermo Fisher Scientific, San
Jose, CA). The high resolution mass data were obtained on an
Ionspec 7.0 T FT-ICR-MS (Ionspec Corporation, Irvine, CA)
with a Z-spray electrospray source. Negative-ion mass spectra
were acquired after the solutions were directly infused into
the source region with a flow rate of 3.0 mL/min. The
parameters were set as follows: the source temperature 80 ꢂC,
probe temperature 100 ꢂC, sample cone voltage 30 V,
extractor cone voltage 5 V, probe high voltage 3.5 kV,
desolvation gas voltage 0.1 V and cone gas voltage 0.85 V.
The spectrum was scanned from m/z 108 to 1000 at 1024 K
data points, with an ADC rate of 2 MHz.
As the concentrations of different metabolites varied
significantly, the metabolites at low concentrations can only
generate small peaks in the ion chromatogram, resulting in
too little time for MSn analysis. To solve this problem, a
channel-switching technique was applied to enrich the
metabolites at low concentrations. In the interface between
LC and MS, a six-port switch was installed. This device has
been commonly used to reduce the flow rate of eluate from
LC to make it suitable for MS. Furthermore, it can also be
used to enrich the metabolites which are of low abundance
and unable to be analyzed online by MSn analysis. The total
ion chromatogram of certain sample, showing the retention
time and peak width of the ion peak of each metabolite, was
Materials and methods
Chemicals and reagents
The standard compounds, AC, mesaconitine and
hypaconitine (purity >99%), were purchased from the
National Institute for the Control of Pharmaceutical and
Biological Products (Beijing, China). Methanol, acetonitrile
and acetic acid were of HPLC grade and were purchased from
Thermo Fisher Scientific, Inc. (Waltham, MA). Purified water
was produced using a Milli-Q ultra-pure water system
(Billerica, MA). All other reagents and chemicals were of
analytical grade.

 Sui, Zhigang