Inorganic Chemistry
Article
sample has been heated from RT to 550 °C at a rate of 10 °C min−1
and cooled from 550 °C to RT at the same rate.
TeO6 chains, despite their probably very close energy. In 2000,
another preparation way was published:22 It corresponds to a
ceramic route which consists of heating at 600 °C of a mixture
of Na2CO3 and TeO2. Unfortunately, no structural details were
given except the cell parameters of a new orthorhombic cell
(10.602, 10.622, and 8.506 Å). In addition, the authors give one
table with 12 hkl and their corresponding dobs and dcal, but our
refinement performed from these few data does not lead to
their published parameters. More recently, a new Na2TeO4
form (denoted as γ-form, orthorhombic Pnna: 13.5390, 8.4169,
and 6.7781 Å) was obtained by Weil et al.23 as minority phase
from treatment of Ba[TeO2(OH)4] in a NaNO3 melt.
Nevertheless, whatever the synthesis mode (except that of
the ref 22), the three Na2TeO4 polymorphs contain edge-
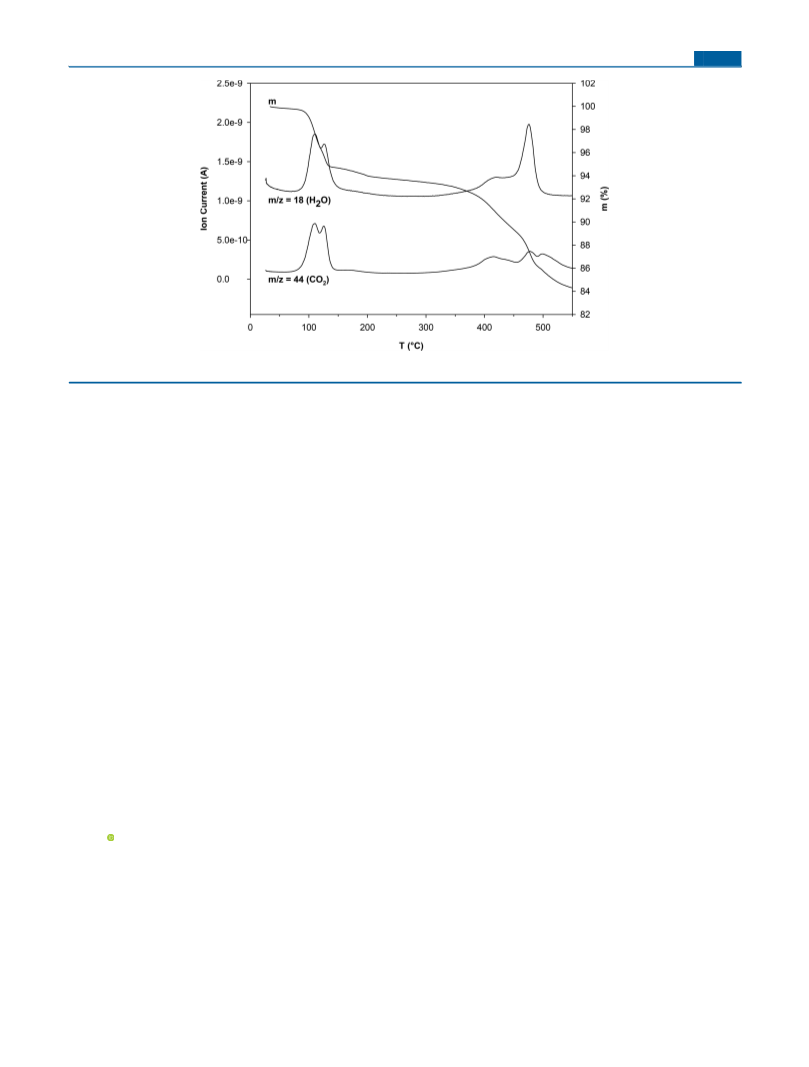
The TGA curve has been registered between RT and 550 °C on a
TGA Jupiter STA 449 F3 Netzsch instrument coupled with a mass
spectrometer Aelos QMS 403C Netzsch allowing the analysis of gas
̈
emitted by the sample during heating.
Ab Initio Calculations. Ab initio calculations were performed with
the ABINIT software.27 A Perdew−Burke−Ernzerhof GGA func-
tional28 was used for the exchange-correlation calculations. FHI
pseudopotentials29 were obtained from the Abinit Web site. The
energy cutoff was held at 45 Ha (1224 eV) and the k-points grid was
that proposed by the software, containing 4 independent k-points.
Raman vibrational frequencies and normal modes were calculated
correcting factor of 1.077 was applied to the calculated frequencies to
take into account the underestimation inherent to the technique. This
factor was chosen to minimize the distance between observed and
calculated Ag modes.
2n−
sharing TeO6 octahedra forming [TeO4]n chains and could
then be interesting candidates toward CO2 capture.
In addition to the CO2 capture property, we present in this
paper the thermal stability of the β-Na2TeO4 orthorhombic
form. Furthermore, except for a room temperature Raman
spectrum appearing in Cornette’s thesis,13 there was no work
on Na2TeO4 vibrational properties. The Raman spectrum was
then measured as a function of temperature while ab initio
computations were performed on the crystallographic struc-
tures that we determined in order to compare their energy.
Scanning Electron Microscopy (SEM) Analysis. SEM images
were obtained using a JSM 6510 LV microscope (JEOL) equipped
with an energy-dispersive X-ray (EDX) OXFORD detector (AZtec
software) to perform elementary microanalyses. For SEM observa-
tions, the particles were coated with gold.
RESULTS AND DISCUSSION
■
Characterization of the Room Temperature Phase.
The different PXRD patterns registered have rapidly revealed
that this compound presented a strong preferential orientation.
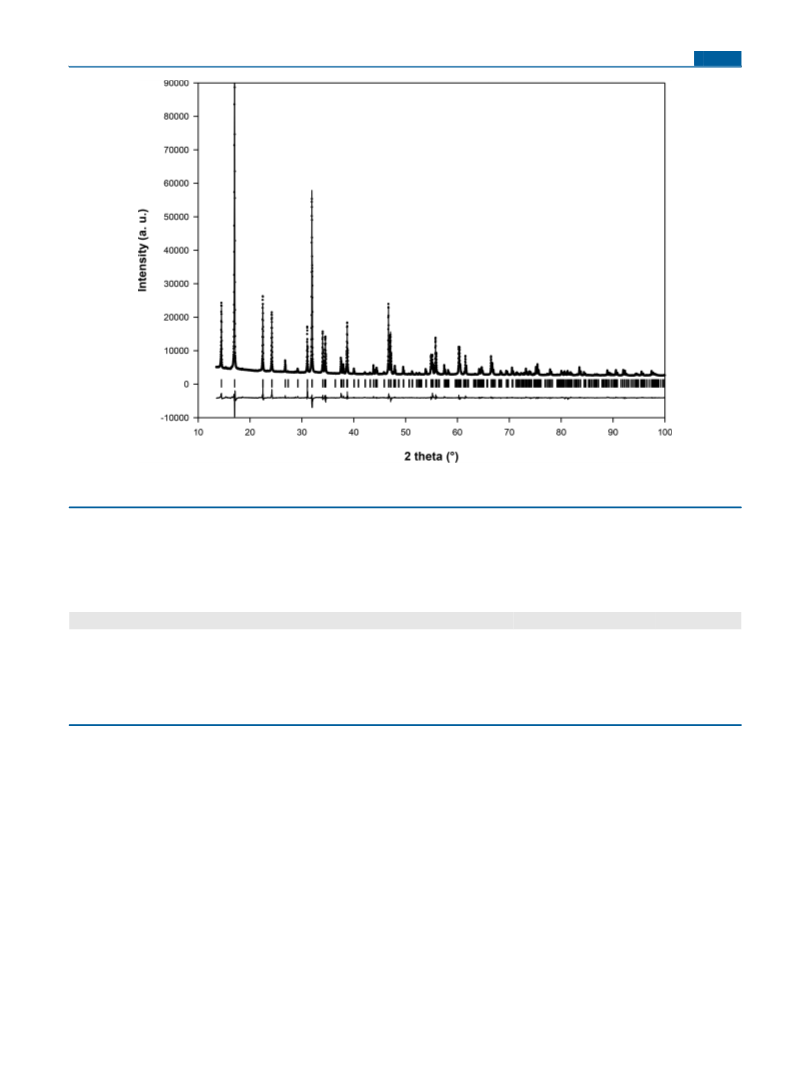
This is clearly showed in Figure 1 where two PXRD patterns
EXPERIMENTAL SECTION
■
Synthesis. We chose to prepare our β-Na2TeO4 sample via a solid-
state reaction. Powders of TeO2 (Acros Organics, 99.8%) and dried
Na2CO3 (Alfa Aesar, 99.99%) in stoichiometric ratio were intimately
mixed in an agate mortar and pressed into pellets. The pellets (1 g;
diameter: 10 mm) were placed in an alumina crucible and heated two
times at 650 °C for 12 h in air. Powder X-ray diffraction (PXRD)
analysis was used after each heating cycle to check the completeness of
the reaction as well as the crystallinity and the purity of the product.
After the synthesis, the obtained white powder was kept immediately
in a dryer to prevent any unwanted hydration taking into account the
study of Kratochvil and Jensovsky.19
Powder X-ray Diffraction. For the structural room temperature
(RT) study, powder X-ray diffraction (PXRD) data were collected in
air with a PANalytical X’pert Pro diffractometer using Cu Kα radiation
equipped with a X’Celerator detector with the following experimental
conditions: angular range, 2θ = 13.55−150.00°; step scan increment,
2θ = 0.0084°; counting time = 12 h.
For the thermal analysis, a PANalytical Empyrean diffractometer
equipped with a high-temperature attachment HRK900 was used with
the Cu Kα radiation. The data were collected under dry air flow every
50 °C between 50 and 600 °C with the following experimental
conditions: angular range, 2θ = 13.00−148.00°; step scan increment,
2θ = 0.0131°; counting time = 6 h.
Figure 1. PXRD pattern of Na2TeO4 at room temperature showing
the strong preferential orientation in the case of a crushed sample.
All the refinements were performed with the Rietveld method24
using the Fullprof program,25 and a pseudo-Voigt function was chosen
to model the peak shape. The background points were determined
manually before being refined.
are presented: one with a crushed sample and a second one
with a sprinkled sample. We indeed observe significant
differences in the relative intensities of the hkl lines on the
two diagrams. This preferential orientation can be explained by
the elongated platelet aspect of the grains evidenced by SEM
image (see Figure S1). This lead us to perform the structural
study at room temperature with the data obtained from a
carefully sprinkled sample on grease to promote a random
orientation of the crystallites. The hkl lines are narrow,
indicating a good crystallization of the powder sample. In
addition, the purity of the sample is quite good since all the
lines could be indexed in the orthorhombic Pbcn (no. 60) space
group with refined cell parameters (a = 5.75845(2), b =
Raman Spectroscopy. The Na2TeO4 Raman spectra were
collected on a pellet with a Renishaw InVia Raman spectrometer in
backscattering mode. The exciting source was an Ar laser operating at
the 514.5 nm green light. The sample was illuminated through a ×50
objective with a long (8 mm) working distance. Raman spectra down
to about 7 cm−1 were obtained with the use of superNotch filters. The
detector was a Peltier-cooled CCD. For the temperature measure-
ments, a Linkam THMS600 cell was used. In order to accurately
measure the sample temperature, we placed a small silicon piece close
to the sample. The temperature was then calculated according to the Si
520 cm−1 band position as described in ref 26.
Thermal Analysis. Differential scanning calorimetry (DSC, 92
Setaram) was used in order to precisely determine the thermal
behavior of Na2TeO4. For this study performed under N2 flow, the
B
Inorg. Chem. XXXX, XXX, XXX−XXX

 Galven, Cyrille