ARTICLE IN PRESS
J. Zhang et al. / Journal of Solid State Chemistry 180 (2007) 1291–1297
1292
region of the electromagnetic spectrum [12] that can be
easily detected. In addition, the plasmon resonance absorp-
tion band of Ag colloid is stronger and sharper in compa-
rison with Cu colloid, and occurs at shorter wavelengths.
The collective plasmon resonance absorption band of the
Ag–Cu alloy colloids will be easily distinguished from that
of Ag or Cu colloids. This would enable us to explore the
coupling between the plasmons of Ag and Cu, and find a
new technique to effectively modify the SPR.
composite particles were washed with ethanol by centrifu-
gation and ultrasonic dispersions.
Transmission electron microscopy (TEM) was per-
formed on a Hitachi Model H-800 transmission electron
microscope operated at 120 kV. Sample colloids were
placed on a carbon-coated copper grid. Scanning electron
microscopy (SEM) was performed on a LEO1530VP
scanning electron microscope. Energy-dispersive X-ray
analysis (EDX) was performed with a LEO153VP scanning
electron microscope. X-ray photoemission spectroscopy
(XPS) measurements were performed using MgKa radia-
tion (VG-ESCALAB-MK-II). The accuracy of the mea-
sured electron energies was 70.055 eV. Quantification of
the elemental concentrations was accomplished by correct-
ing photoelectron peak intensities for their cross sections.
X-ray diffraction (XRD) was carried out on a Rigaku
D/max-RA X-ray diffraction meter with CuKa radiation
2. Experimental details
The as-prepared silica colloids [13] with average diameter
of 500 nm were seeded with silver nanoparticles at first by
the electroless plating approach [9]. In brief, 20 ml freshly
prepared [Ag(NH3)2]+ ions (0.1 M) solution was added
into 80 ml as-prepared silica colloids suspension containing
1% PVP under stirring. The [Ag(NH3)2]+ ions were
absorbed onto the colloids surface by the negatively-
charged Si–OH groups through electrostatic attraction.
The negatively-charged Si–OH groups are the origin of the
surface charge to protect colloids from aggregation. After
30 min, the colloids were washed with ethanol by centri-
fugation and ultrasonic dispersion to remove the excessive
[Ag(NH3)2]+ ions, and dispersed in ethanol solution
(80 ml). Subsequently, 0.5% KBH4 solution (10 ml) was
added quickly to reduce the [Ag(NH3)2]+ ions absorbed on
the colloids surface to seed the silica colloids. The color of
the solution turned from white to light brown at once.
After 30 min, the colloids were washed with distilled water
to remove the excessive KBH4, and the silica colloids
seeded with Ag nanoparticles were obtained. Methanol
(10 ml), 0.5 g CuSO4 ꢀ 5H2O, 2.5 g NaKC4H4O6 ꢀ 4H2O, and
0.4 g NaOH were dissolved in turn in 20 ml distilled water,
then the solution was added into 30 ml ethanol solution
containing ꢁ0.25 g silica colloids after seeding under
stirring. After 2 min, 1 ml formaldehyde was added to
alloy Cu into Ag nanoparticles for one hour. During the
alloying reaction process, Cu2+ ions were reduced into Cu
through the following reaction:
˚
(l ¼ 1.5418 A). Raman spectra were measured with a Spex
1403 Raman spectrometer. All the spectra were recorded
under identical experimental conditions: 488 nm excitation
line of an argon laser, power 5 mW at the sample, three
accumulations of 120 s counting time each. For the
measurements of XRD, SEM, XPS, and Raman spectra,
the sample thin films were prepared as follows. A few drops
of suspension were spread onto a glass substrate, and dried
under the protection of nitrogen gas. Transmission spectra
were recorded on a U-3410 spectrophotometer. Sample
colloids were diluted with ethanol for the measurements.
Quartz cells with about 1-mm path length were used in the
experiment.
3. Results and discussion
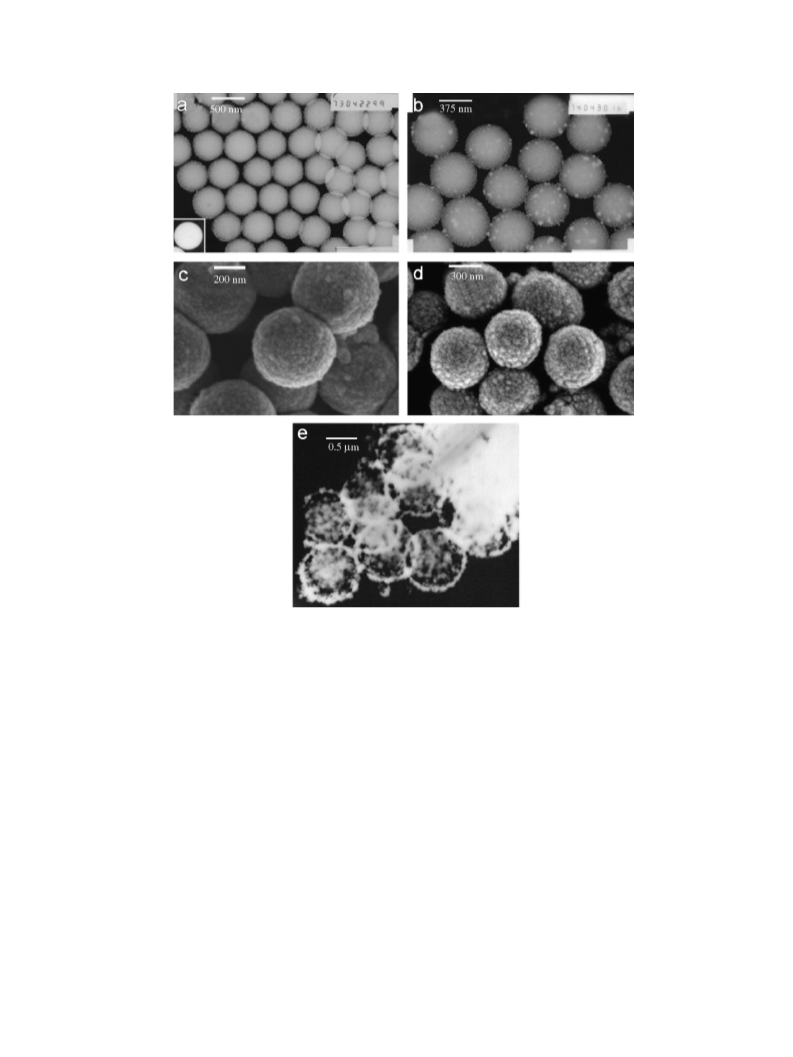
Fig. 1 shows the typical TEM and SEM images of the
silica colloids at different stages of the coating process. As
seen in Fig. 1a, compared with the pure silica colloids (see
inset), the surface of the silica colloids after seeding process
was uniformly covered by Ag nanoparticles with average
diameter of ꢁ7 nm. After one times Cu alloying reaction,
both the coverage and size of the metal nanoparticles
CuSO4 þ 3NaOH þ HCHO Ag nanoparticles
Cu þ Na2SO4 þ HCOONa þ 3H2O:
ꢂ!
NaKC4H4O6
In the reaction, Ag nanoparticles work as the catalyst for
the formation of Cu, and the formation of Cu2O is
suppressed. Even if trace Cu2O appears in solution, most of
them will be reduced further into Cu due to the catalyst
effects of Ag nanoparticles. When the binary metallic
particles size reduces to nanoscale, the diffusion between
the two metals is enhanced greatly, and the spontaneous
alloying appears [14–16]. Here, the catalyst role and
nanoscale size of Ag particles make the diffusing of Cu in
Ag nanoparticles easy, and lead to the formation of Ag–Cu
alloy. The Cu alloying reaction step was repeated to
increase the Cu component in the alloy shell. Finally, the
(ꢁ11 nm) on the silica core increased, and the shell
thickness increased to ꢁ12 nm (Fig. 1b). The second Cu
alloying reaction further increased the size and shell
thickness of the metal nanoparticle to ꢁ15 and ꢁ16 nm
(Fig. 1c), respectively. After the third Cu alloying reaction,
the shell thickness increased to ꢁ 22 nm (Fig. 1d), but was
still too thin to sustain the dissolution of the silica core. As
seen in Fig. 1e, most of the hollow Ag–Cu alloy spheres
obtained by dissolving the silica core using HF acid were
broken and aggregated together. Due to the coalescence of
the seeds during the seeding growth process [9,10], the
metal nanoparticles tended to be heterodisperse. Some

 Zhang, Jianhui