Chemistry Letters 2001
143
This study was financially supported by Special
Coordination Funds for Promoting Science and Technology
from the Japanese Science and Technology Agency.
References and Notes
1
a) E. A. Neppiras, Phys. Rep., 61, 159 (1980). b) A.
Henglein, Ultrasonics, 25, 6 (1987). c) A. A. Atchely and
L. A. Crum, in “Ultrasound Its Chemical, Physical and
Biological Effects,” ed. by K. S. Suslick, VHC Pub. Inc,
Weinheim (1988), p. 1. d) T. Kimura and T. Ando, J. Syn.
Org. Chem., 46, 1124 (1988). e) G. J. Price, “Current
Trend in Sonochemistry,” Royal Society of Chemistry,
Cambridge (1992). f) P. Riesz and T. Kondo, Free Radical
Biol. Med., 13, 247 (1992). g) T. Lepoint and F. Lepoint-
Mullie, in “Advances in Sonochemistry,” ed. by T. J.
Mason, JAI Press, Stanford (1995), Vol. 5, p. 1. h) M. A.
Margulis, “Sonochemistry and Cavitation,” Gordon and
Breach Pub., Amsterdam (1995). i) J.-L. Luche, “Synthetic
Organic Sonochemistry,” Plenum Press, New York (1998).
j) L. A. Crum, T. J. Mason, J. L. Reisse, and K. S. Suslick,
“Sonochemistry and Sonoluminescence,” Kluwer
Academic Pub., Dordrecht (1999).
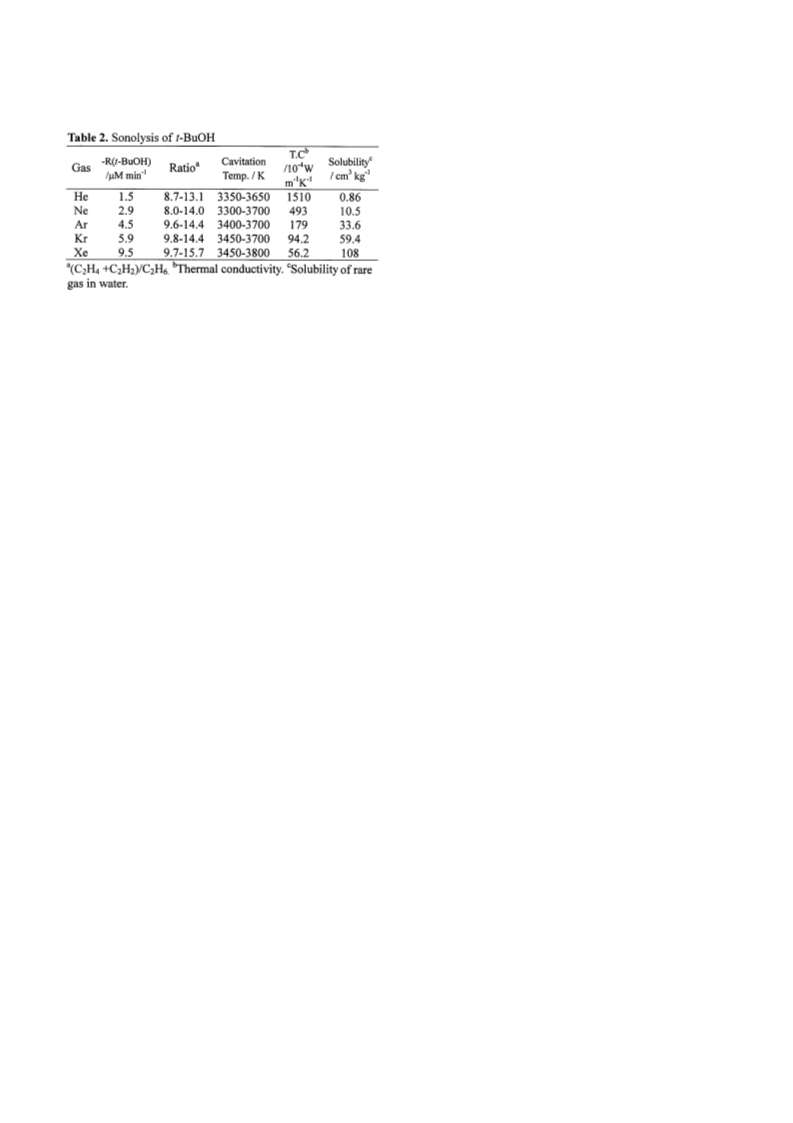
Table 2 shows the sonolysis data of the aqueous t-BuOH
solution at concentrations of 0.1, 0.5, 1, 2.5, 5 and 10 mmol/L.
The order of the rate of t-BuOH degradation was same as the
rate of water degradation.
During the sonolysis of volatile organic substances, ethane,
ethylene and acetylene are formed along with other pyrolysis
products. The cavitation temperature can be estimated from the
1
1–13
ratio [R(C H ) + R(C H )] / R(C H ).
The ratio and esti-
2
4
2
2
2
6
1
4
mated temperature are shown in Table 2. The temperature
under argon was in good accord with the reported value of
aqueous t-BuOH sonolysis under argon (3600K) but some-
2
3
a) D. J. Peters, Mater. Chem., 6, 1605 (1996). b) K. S.
Suslick and G. J. Price, Annu. Rev. Mater. Sci., 29, 295
1
3
what lower than that estimated from the sonoluminescence
experiments in dilute aqueous benzene (4300K).
(1999). c) A. Kotronarou, J. Mills, and M. R. Hoffmann, J.
1
5
Phys. Chem., 95, 3630 (1991). d) Y. Nagata, K. Hirai, K.
Okitsu, and Y. Maeda, Chem. Lett., 1995, 203.
a) Y. Nagata, K. Hirai, and Y. Maeda, Environ. Sci.
Technol., 30, 1133 (1996). b) Y. Mizukoshi, K. Okitsu, Y.
Maeda, T. Yamamoto, R. Oshima, and Y. Nagata, J. Phys.
Chem. B, 101, 7033 (1997).
Y. Nagata, Y. Mizukoshi, K. Okitsu, and Y. Maeda,
Radiat. Res., 146, 333 (1996).
T. Kondo, J. Gamson, J. B. Mitchell, and P. Riesz, Int. J.
Radiat. Biol., 54, 955 (1988).
It is considered at this time that the extent of the cavitation
effects depends on the thermal conductivity of the gas; the
greater the conductivity of the gas, the more heat is dissipated
to the surroundings, effectively decreasing the cavitation tem-
perature. In fact, the cavitation temperatures estimated from the
multi bubble sonoluminescence from Cr(CO) in octanol were
6
4
5
6
7
reported to be Xe (5100K) > Kr (4400K) > Ar (4300K) > Ne
(
4100K) > He (3800K) which is the same order of decreasing
1
6
thermal conductivity. However, our results exhibited some-
what different features from these results. In both cases for the
sonolysis of water and t-BuOH, the degradation rates were Xe >
Kr > Ar > Ne > He with a significant difference. On the other
hand, the cavitation temperature is in the same order but the dif-
ference is small, that is, the thermal conductivity of the gas does
not appreciably affect the cavitation temperature.
H. Hua and M. R. Hoffmann, Environ. Sci. Technol., 31,
2237 (1997).
C. A. Wakeford, R. Blackburn, and P. D. Lickiss,
Ultrason. Sonochem., 6, 141 (1999).
8
9
F. R. Young, J. Acoust. Soc. Am., 60, 100 (1976).
During sonolysis under He or Ne, the amount of oxygen
formation was negligibly small, and accordingly, the
amount of hydrogen formation can be estimated as equal to
that of the hydrogen peroxide formation.
As another factor for the effect of cavitation, the solubility
of the rare gas in water attracted our attention. The rate of
sonolysis of water and t-BuOH increased with the increasing
solubility (Table 2). A similar trend in solubility dependence
10
N. Cohen and R. Westberg, J. Phys. Chem. Ref. Data, 12,
531 (1983).
7
was reported for the H O formation from water sonolysis
2
2
under Ar and N atmospheres.
2
11 J. Warnatz, Ber. Bunsenges. Phys. Chem., 87, 1008 (1983).
The present results suggest that increasing solubility leads
to a larger number of cavitation nuclei and an enlarged chance
of chemical reaction, and that the collapse of the bubbles is so
rapid that it proceeds nearly adiabatically, therefore, the differ-
ence in the thermal conductivity of the different gases is not
very significant. However, it may be premature to draw any
conclusions from the results of only the t-BuOH sonolysis. The
effects of various conditions such as frequency and intensity of
ultrasound and solvent and solute should be considered and
additional accumulation of pyrolysis data from the sonolysis of
volatile organic compounds is required for a detailed discussion
of the cavitation temperature based on the chemical reaction.
1
1
1
2
3
4
E. J. Hart, C.-H. Fischer, and A. Henglein, Radiat. Phys.
Chem., 30, 511 (1990).
A. Tauber, G. Mark, H.-P. Schuchmann, and C. von
Sontag, J. Chem. Soc., Perkin Trans. 2, 1999, 1129.
The ratio equals the ratio k /k , k (rate constant for 2CH
3
1
2
1
14 –0.4
3
–1 –1
→
C H ) = 2.4 × 10 T dm mol s , k (rate constant
2
6
2
16
for 2CH → C H + H ) =1.0 × 10 exp(–134kJ/RT)
3
2
4
2
3
–1 –1
dm mol s
1
5
6
Y. T. Didenko, W. B. MacNamara, III, and K. S. Suslick,
J. Am. Chem. Soc., 121, 5817 (1999).
W. B. MacNamara, III, Y. T. Didenko, and K. S. Suslick,
Nature, 401, 772 (1999).
1

 Nagata, Yoshio