L. Hang et al. / Journal of Alloys and Compounds xxx (xxxx) xxx
3
2.4. Preparation of cage-like Ag submicrocubes
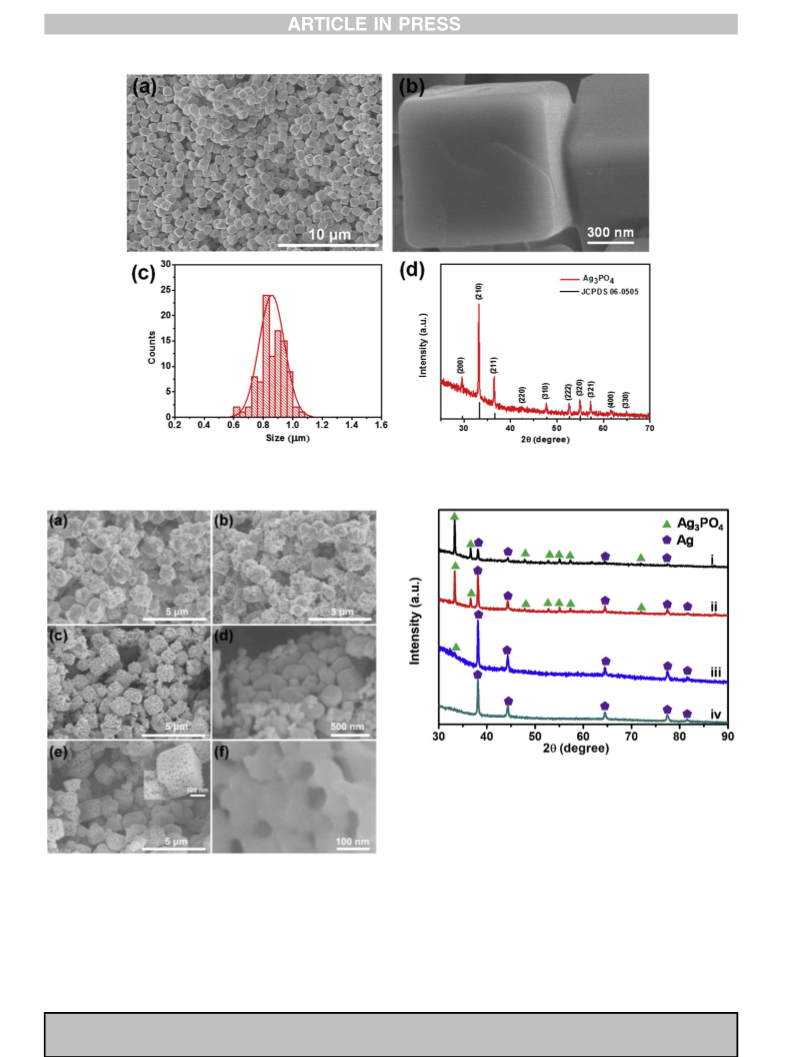
keeping the other conditions unchanged. As shown in Fig. 2a, when
the concentration of NaBH4 is 0.25 mM, only a few nonuniform Ag
NPs anchored on the surface of the Ag3PO4 particles are observed.
Meanwhile, the morphology of the residual Ag3PO4 submicrocubes
becomes irregular. By increasing concentration of NaBH4 to
0.50 mM, the number of Ag NPs with different sizes increases, as
shown in Fig. 2b. As the concentration of NaBH4 is increased to
1.00 mM, the number of produced Ag NPs is further increased, but
Ag3PO4 still exists, as shown in Fig. 2c. A magnified SEM image
(Fig. 2d) shows that the produced Ag NPs undergo self-assembly to
form a 3D architecture with a highly rough surface. Additionally,
when the concentration of NaBH4 is gradually increased to
2.00 mM, micrometer-sized ligament networks are formed at large
quantities and no obvious Ag3PO4 particles are observed in the SEM
image (Fig. 2e). The sponge-like submicrocubes inherit the shape
and size of the templates well, and are composed of a nanoporous
and 3D network of interconnected nanoligaments. Moreover, these
nanoligaments are not uniform in size and are created by many
nanosections and nanobranches (Fig. 2f). This phenomenon is
coincident with Eswaramoorthy’s results [1], which can be ascribed
to the formation of nanoligaments through the fusion of small NPs.
Furthermore, as the concentration of NaBH4 further increases to
4.00 mM, the products are also sponge-like submicrocubes, similar
to the products prepared at a NaBH4 concentration of 2.00 mM
(Fig. S3), indicating that sponge-like submicrocubes with a rela-
tively monotonous surface topography can be obtained by using
Ag3PO4 submicrocubes as sacrificial templates when the concen-
tration of NaBH4 exceeds 2.00 mM.
Cage-like Ag submicrocubes were also obtained from Ag3PO4
submicrocubes by reducing with NaBH4. Briefly, 1 mL of an Ag3PO4
submicrocube aqueous solution was dispersed into 9 mL deionized
water, and then, 20
mL of a NaBH4 solution (0.5 M) was added
dropwise into the above solution under stirring at room tempera-
ture for approximately 2 min. When the reaction was completed,
the produced black solids were found to be floating on the reaction
medium. The floating solids were collected by centrifugation and
washed with deionized water. Then, the solid samples were
redispersed into 3 mL deionized water, followed by the addition of
12 mL of a NaBH4 aqueous solution (0.5 M). The final product was
separated by centrifugation and dried at room temperature in
vacuum.
2.5. Instrumentation and characterization
The morphologies of the obtained samples were observed
through a field-emission scanning electron microscope (FE-SEM,
Sirion 200) at an accelerating voltage of 10 kV. The composition of
the synthesized products was analyzed by Energy-dispersive X-ray
spectroscopy spectra (EDS) using an Oxford INCA analysis system.
The X-ray diffraction (XRD) patterns were measured by a Philips
X’pert Pro X-ray diffractometer with Cu
Ka
radiation
(
l
¼ 0.15419 nm). The XRD patterns were measured from 20ꢃ to 90ꢃ
with a scanning rate of 5ꢃ/s. The UVeViseNIR spectra were
measured using a UV/Vis spectrophotometer (Cary 500, Varian).
Raman spectra were obtained through a confocal microprobe
Raman spectrometer (Renishaw inVia Reflex) with a laser wave-
length of 785 nm, a power of 0.5 mW and an integration time of 5 s.
For the SERS intensity mapping investigation, the laser power and
integration time were set as 0.5 mW and 1 s, respectively.
To further confirm the evolution of the constituents, the XRD
patterns of the as-prepared products obtained with different con-
centrations of NaBH4 are presented in Fig. 3. When the concen-
tration of NaBH4 is 0.25 mM, the XRD pattern (curve i) confirms
that the samples are composed of two components: Ag and Ag3PO4.
The peaks at 2
q
¼ 38.14ꢃ, 44.42ꢃ, 64.54ꢃ and 77.42ꢃ belong to the
3. Results and discussion
(111), (200), (220) and (311) lattice planes of the fcc structure of Ag,
respectively. Compared to the standard spectrum of Ag3PO4 in the
3.1. Morphology control of porous Ag submicrocubes
range from 2
q
¼ 30ꢃe70ꢃ, the remaining main peaks can be
matched to the structure of Ag3PO4. When the concentration of
NaBH4 is increased to 0.50 mM, its XRD pattern is also consistent
with that for a mixed phase of Ag3PO4 and Ag, as shown by curve ii
in Fig. 3. Furthermore, when the concentration of NaBH4 is
increased to 1.00 mM, the intensities of the peaks due to Ag3PO4
significantly decrease and the characteristic peaks due to Ag
remarkably increase in the XRD patterns, as shown by curve iii from
Fig. 3. It is worth noting that all the peaks of the sample can be
attributed to Ag with a fcc structure (JCPDS 01e1164) upon
increasing the concentration of NaBH4 to 2.00 mM, as shown by the
curve iv in Fig. 3. Meanwhile, no characteristic diffraction peaks due
to the Ag3PO4 crystal or other impurities are observed, indicating
that the final products consist of a pure fcc structure for Ag. This
result demonstrates that the synthesized products are composed of
a pure phase Ag at a NaBH4 concentration of 2.00 mM. Further-
more, the EDS result shows that only Ag is detected (Fig. S4),
indicating that Ag3PO4 is completely reduced to Ag, which is
consistent with the XRD results.
In this work, porous Ag submicrocubes were synthesized using
Ag3PO4 submicrocubes as sacrificial templates, which were pre-
pared at room temperature by a simple reaction of the [Ag(NH3)2]þ
complex with Na2HPO4 aqueous solutions, as described in previous
reports [37,38]. Fig. 1a shows a low-magnification SEM image of the
Ag3PO4 submicrocubes. It can be clearly seen that submicrocubes
were prepared with smooth surfaces and sharp corners and edges,
as shown in Fig. 1b. And the average size of the edge of the as-
prepared submicrocubes is approximately 860 nm (Fig. 1c). More-
over, the EDS result (Fig. S1) shows that only O, P, and Ag are
detected in the submicrocubes. Furthermore, all the diffraction
peaks observed in the XRD pattern of the submicrocubes (Fig. 1d)
correspond to an Ag3PO4 crystal with a body-centered cubic
structure (JCPDS 06e0505) [37]; these diffraction peaks are
assigned to the (200), (210), (211), (220), (310), (222), (320), (321),
(400) and (330) planes, indicating that Ag3PO4 submicrocubes were
successfully prepared with high yield.
The as-prepared Ag3PO4 microcubes were used as templates to
synthesize porous Ag particles by using NaBH4. In the preparation
process, it is noteworthy that when the NaBH4 aqueous solution
was added into the Ag3PO4 suspension, the color of the solution
immediately changed from tawny to dark gray, as shown in Fig. S2.
Subsequently, we found that black solids were produced that
floated on the reaction solution. To study the effect of the con-
centration of NaBH4 on the formation of the porous Ag particles, a
series of experiments with different NaBH4 concentrations
(0.25 mM, 0.50 mM, 1.00 mM and 2.00 mM) were carried out,
Next, we found that cage-like Ag submicrocubes can also be
prepared from the Ag3PO4 templates by a secondary reduction. In
brief, the as-prepared samples composed of Ag and Ag3PO4 with a
3D architecture (Fig. 2c and d) prepared via reduction with 1.00 mM
NaBH4 were further reduced by using 2.00 mM NaBH4. The SEM
images (Fig. 4aec) show that cage-like Ag submicrocubes with a
rough surface are obtained by a secondary reduction. The obtained
hollow Ag submicrocubes also maintain the shape of the Ag3PO4
templates. Compared with the sample obtained by a single reduc-
tion at a NaBH4 concentration of 1.00 mM (Fig. 2c), no obvious
Please cite this article as: L. Hang et al., Green and rapid synthesis of porous Ag submicrocubes via Ag3PO4 templates for near-infrared surface-

 Hang, Lifeng