138
L. Yang et al. / Applied Catalysis A: General 455 (2013) 137–144
2. Experimental
2.1. Catalyst preparation
STY(H2)) could be calculated through the yields of CO2 and CO. All
data were taken 24 h after the reaction started (unless otherwise
specified).
The CNTs used in the present work were prepared following
the method reported previously [14]. The freshly prepared CNTs
were purified with treatment of nitric acid (8 mol/L at 363 K) for
8 h, followed by rinsing with de-ionized water twice, and then
drying at 383 K under N2-atmosphere. Open-ended CNTs with
somewhat hydrophilic surface were then obtained. For the puri-
fied CNTs, contents of the total carbon and the graphitized carbon
were ≥99.5% and ≥90% (mass%), respectively.
2.3. Catalyst characterization
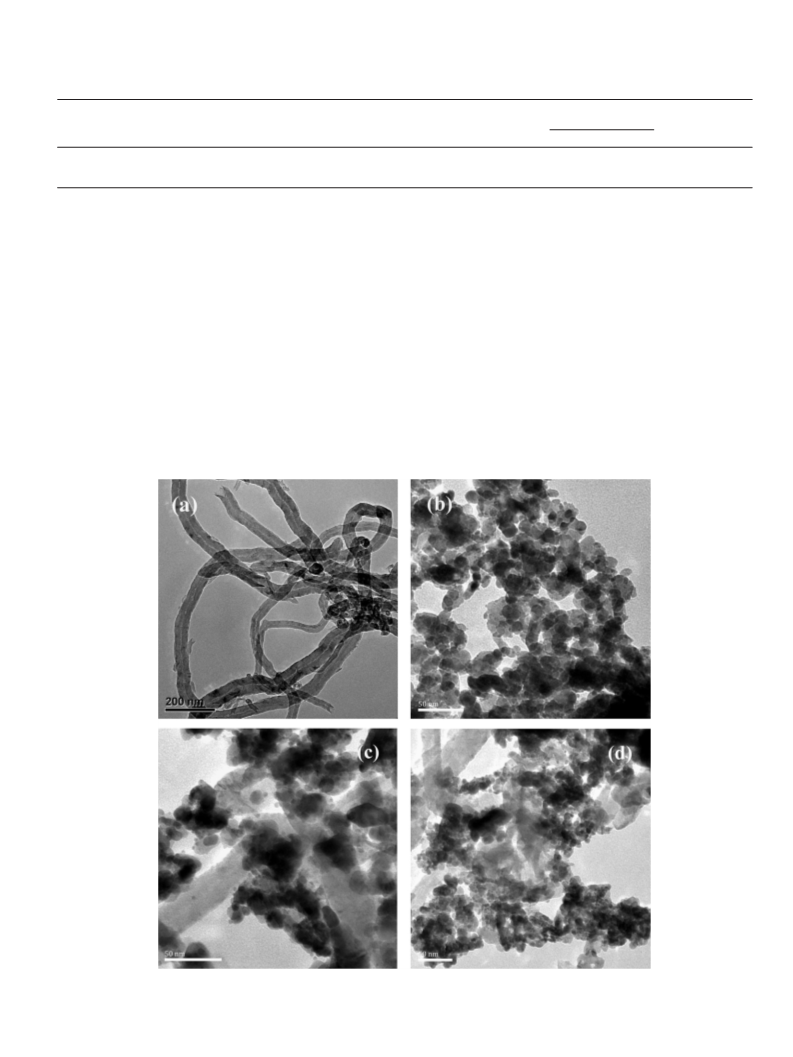
Transmission electron microscopy (TEM) and energy-dispersive
X-ray spectroscopy (EDX) measurements were performed on
JEM-1400 and Hitachi S-4800 electron microscopes, respectively.
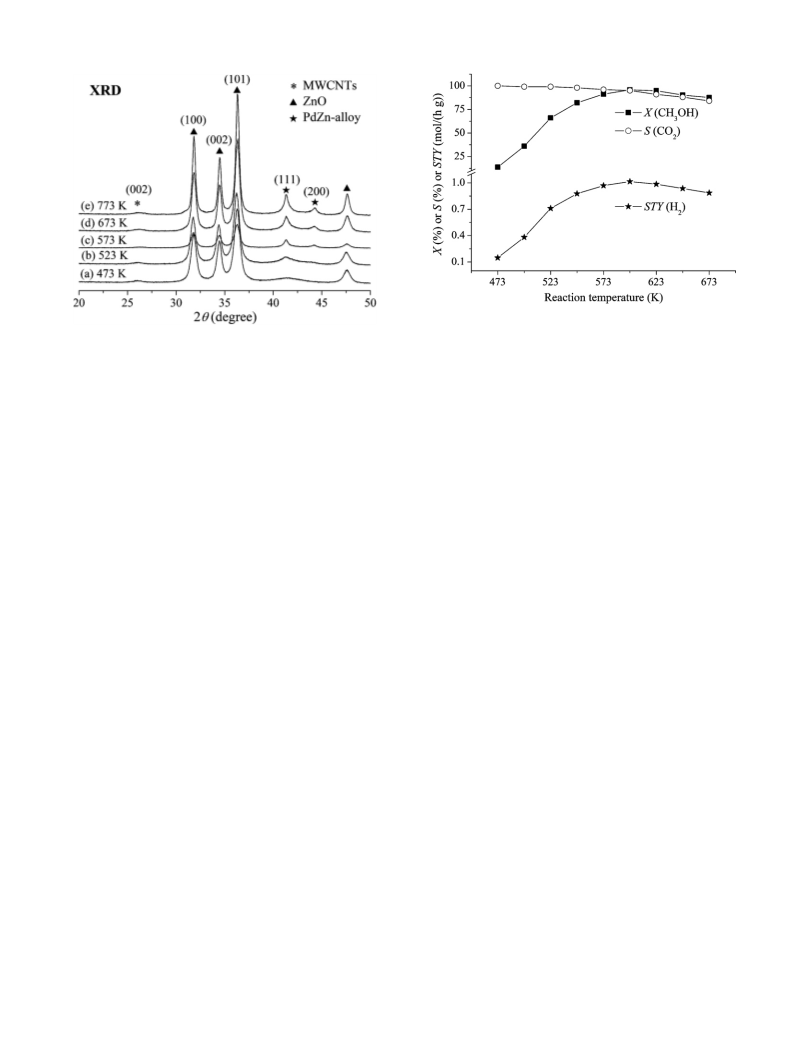
XRD measurements were carried out on an X’Pert PRO X-
ray diffractometer (PANalytical) with Cu K␣ (ꢀ␣1 = 0.15406 nm,
ꢀ␣2 = 0.15443 nm) radiation. A continuous scan mode was used
to collect 2ꢁ data from 10◦ to 90◦. The voltage and current were
40 kV and 30 mA, respectively. X-ray photoelectron spectroscopy
(XPS) measurements were done on a Quantum 2000 Scanning
ESCA Microprobe instrument with Al K˛ radiation (15 kV, 25 W,
hꢂ = 1486.6 eV) under ultrahigh vacuum (5 × 10⁻⁷ Pa), calibrated
internally by the carbon deposit C(1s) (Eb = 284.7 eV).
Specific surface area (SSA) was determined by N2 adsorption
using a Micromeritics ASAP 2020 system. Measurement of CO
chemisorption on the catalysts was performed by a Micromeritics
ASAP-2010 Micropore Analyzer. 0.1–0.2 g of catalyst sample was
used for each test. The sample was put into a quartz tube, followed
by evacuating for 10 min at 393 K, then switching to a purified H2
stream (30 mL min−1) as reducing gas to conduct an in situ H2-TPR
treatment of the catalyst sample, subsequently evacuating for 1 h
at the reduction temperature and another 1 h after cooling down
to room temperature, and then switching to gaseous CO (of 99.99%
purity) to conduct the CO chemisorption measurement. From the
determined amount of chemisorbed CO, the dispersion and surface
area of metallic palladium were calculated [17].
A series of Pd–ZnO or Pd–ZnO–Sc2O3 catalysts doped with CNTs,
denoted as PdiZnj(or PdiZnjSck)–x%(mass percentage)CNTs, were
prepared by a co-precipitation method. An aqueous solution con-
taining calculated amounts of PdCl2 and Zn(NO3)2·6H2O (or as well
as Sc(NO3)3·6H2O) was added dropwise under vigorous stirring
into a Pyrex flask containing a certain amount of aqueous Na2CO3
solution at 333 K. The addition was adjusted to maintain the pH of
the suspension at 9–10. The suspension was continuously stirred
for 30 min at 333 K, followed by cooling down to room tempera-
ture before filtering. The filtered cake was repeatedly washed with
deionized water until the filtrate became neutral in pH. The washed
solid was added into a suspension prepared in advance contain-
ing calculated amounts of CNTs, followed by stirring vigorously for
4 h, and then centrifuging-filtering. The obtained solid was dried at
383 K for 12 h and calcined at 633 K for 2 h, yielding the precursor of
PdiZnj–x%CNTs or PdiZnjSck–x%CNTs catalysts (in oxidation state).
The CNT-free counterparts were prepared in the similar man-
ner, and used as reference. All samples of catalyst precursor were
pressed, crushed, and sieved to a size of 20–40 mesh for the activity
evaluation.
Tests of H2-temperature-programmed reduction (H2-TPR) of
oxidation precursor of the catalysts were conducted on a fixed-bed
continuous-flow micro-reactor. A NaOH-column and a 3A-zeolite
column were installed in sequence at the reactor-exit to remove
water vapor formed by the reduction of metal oxides of the cat-
alyst sample. Fifty mg of catalyst sample was used for each test.
The sample was first flushed by an Ar (of 99.999% purity) stream
(60 mL min−1) at 393 K for 60 min to clean its surface, and then
cooled down to room temperature, followed by switching to a
N2-carried 5 vol% H2 gaseous mixture as reducing gas to start the
2.2. Catalyst evaluation
Activity tests of the catalyst for MSR were carried out in a
fixed-bed continuous-flow reactor-GC combination system. Cat-
alyst (0.200 g) was mixed with 4.0 g quartz sand (inert diluents,
20–40 mesh) to order to maintain isothermal conditions, and
placed in the reactor. Prior to the reaction, the catalyst was pre-
reduced in situ under purified H2 stream (0.1 MPa and 1800 mL h−1).
The reduction temperature was programmed to rise from room
temperature to 523 K and maintain at that temperature for 12 h,
before being brought to the desired temperature for the cata-
lyst test. The MSR reaction was conducted at a stationary state
under the reaction conditions of 0.5 MPa and 473–673 K. A pre-
mixed feed-liquid of methanol and water (molar ratio of 1:1) was
introduced into the reactor by using a syringe pump (Series II
Pump, 10 mL Heads). Prior to entering the reactor, the feed-liquid
was fully vaporized through a vaporizer, operating at 473 K. N2 (of
99.99% purity) was used as the dilution gas to maintain the mol%
of the pre-mixed CH3OH–H2O (molar ratio of 1:1) in the feed-gas
((CH3OH–H2O) + N2) at the desired level (controlled by Model D08-
1F flow control valve). The corresponding gas hourly space velocity
(GHSV) of the feed-gas ranged in 54,000–216,000 mL h−1 g−1. A
glass condenser at 278 K was used to separate liquid products from
gaseous products. The gaseous products were analyzed by an on-
line GC (Model GC-2014C, Shimadzu) equipped with a TCD detector
and a column filled with carbon molecular sieve (TDX-01, 2.0-m
length), which was used for the analysis of N2 (as internal standard),
CO and CO2. The experimental results showed that CO2 and CO
were the only two carbon-containing products of the MSR reaction,
without other possible carbon-containing products detected. Thus,
selectivity to CO2 and CO (symbolized as S(CO2) and S(CO)) could
be determined by an internal normalization method, and methanol
conversion (noted as X(CH3OH)) and H2 space-time-yield (noted as
TPR observation. The rate of temperature increase was 5 K min−1
.
Change of hydrogen-signal was monitored by an on-line GC (Shi-
madzu GC-8A) with a TC detector.
Tests of H2-temperature-programmed desorption (H2-TPD) of
the catalysts were conducted on an adsorption/desorption system.
Two hundred milligram of the catalyst precursor was used in each
test. Prior to the H2-TPD test, the sample of catalyst-precursor was
in situ pre-reduced in a H2 (of 99.999% purity) stream (900 mL h−1
)
at 523 K for 2 h and then flushed by an Ar (of 99.999% purity) stream
(1800 mL h−1) at 433 K for 30 min to clean its surface, followed
by switching to the H2 (of 99.999% purity) stream for hydrogen
adsorption for 30 min and subsequently at room temperature for
4 h. Afterwards, the sample was flushed by the Ar stream at room
temperature until the stable baseline in GC appeared. TPD measure-
ments were then conducted from 298 K to 1073 K. The rate of tem-
perature increase was 5 K min−1. Change of hydrogen-signal was
monitored by an on-line GC (Shimadzu GC-8A) with a TC detector.
3. Results and discussion
3.1. Optimization of the catalyst composition
The reactivity of MSR over a series of Pd0.15Zn1–x%CNTs
catalysts
with
varied
amounts
of
CNTs
was
first

 Yang, Lu